Our Team
We have a team of three senior materials engineering undergraduates at California Polytechnic State University, San Luis Obispo

Kristina Babayev
Research Analyst/Toxicity Testing coordinator
My role in this project was to prepare our ryegrass plants for testing and analysis as well as conduct research. I took the lead in Brix refractometer testing and data analysis of our toxicity results.

Diana Reihaneh
Mud sample producer/Slope box testing coordinator
I was in charge of monitoring slope box testing and producing mud samples for all trials. I took the lead to ensure that the proper ratios of dental cements were added to mud mixtures and that all trials had consistent dental cement setting times. I also played a significant role in performing toxicity testing and analyzing toxicity results.

Emily Johnson
Task Coordinator/
Viscometer testing coordinator
For this project I made sure that all tasks were completed in a timely manner. When testing began, I took the lead on conducting the viscometer tests and analyzed the resulting data, turning it into graphical and tabular visuals that are easy for our audience to understand.
Acknowledgements
We would like to personally thank our senior project advisor Dr. Jean Lee for her constant guidance throughout this project, Craig Stubler for allowing us to work in the Cal Poly greenhouse during such unprecedented times, Professor Beaton for always being a helping hand, Professor Rees for collecting the soil used for our experiments, Professor Ulric Lund and Professor Soma Roy for their statistics consulting.
Dental Cement Thickening Agents for Mudslide Prevention
Introduction
Dental Cements for mudslide prevention
The purpose of our project was to characterize a non-toxic mud thickening agent for the application of decreasing mudslide intensity using dental cements. Mudslides cost billions of dollars in recovery efforts and result in dozens of lives lost every year. Zinc phosphate, glass ionomer, and polycarboxylate dental cements were investigated as thickening agents due to their strong adhesion mechanisms and biocompatibility. These dental cements were vetted through tests of viscosity, flow rate, and toxicity to evaluate each cement’s thickening ability.
Hypothesis
- If…we can use adhesives in dentistry that are non-toxic, then… we could also incorporate them into mudslide-prone environments to slow down the flow rate of mud and debris after heavy rainfall.
Background
After heavy rainfall, exposed ground can become oversaturated, turning the soil into a flow of mud that acts as a liquid traveling down steep slopes. Annually, mudslides kill 25-50 people in the United States while internationally thousands of people are killed by this type of natural disaster. They are especially prevalent after wildfires when the soil on hillsides becomes loose due to the lack of support from the plant root systems. The ash and oily debris left after a wildfire can cause the top layer of soil to act hydrophobic leaving the hillside surface susceptible to erosion and can last between three to five years, the amount of time on average it takes for vegetation to grow back. This is why it is necessary to target the mud by adding thickening agents to slow the occurrence of mudslides.
Materials
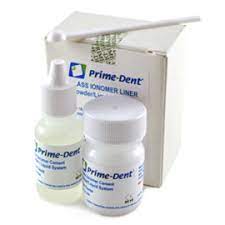
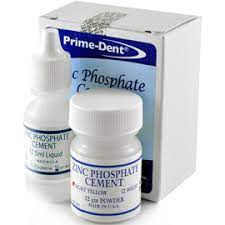
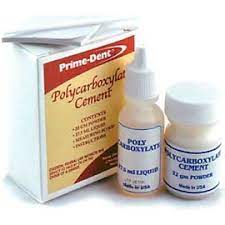
The dental cements selected for this project consist of a two-part powder and liquid system that when combined produce an acid-base reaction.
Zinc Phosphate Dental Cement
The mechanism for adhesion in zinc phosphate dental cement is mechanical interlocking, where the adhesive sticks to the substrate it is in contact with by flowing into the pores of the material, locking them together. The acid portion of this dental cement consists of hydrated alumina, phosphoric acid, and water with zinc metal oxide powder as the base (Figure 1). We chose zinc phosphate dental cement since it is an industry standard and bonds mechanically rather than chemically.

Rajput, M. Quora. March 23, 2020. https://www.quora.com/What-are-the -disadvantages-of-zinc-phosphate-cement
Glass ionomer Dental Cement
Glass ionomer dental cement has polymeric acid and alumino-silicate glass and fluorite powders as a base. The mechanism for adhesion is an ion-exchange layer that develops at the interface. The glass network formed is made up of linked aluminate and silicate tetrahedra (Figure 2). Glass ionomer was chosen for its promising chemical bond between tetrahedra between ions.
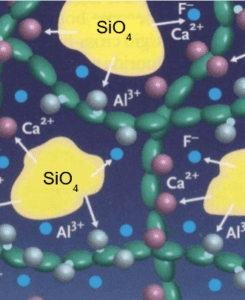
Kodityala Consultant Endodontist at Hyderabad Follow, J. Glass ionomer cement and its recent advances- by Dr. Jagadeesh Kodity. SlideShare.
Polycarboxylate Dental Cement
The two-part system of the polycarboxylate dental cement consists of a polyacrylic acid with a zinc oxide powder base (Figure 3). The mechanism for adhesion for polycarboxylate dental cement is the formation of a matrix of polyacid chains with zinc ion cross-linkers. Polycarboxylate cement was chosen due its weak acid formulation which can correlate to low toxicity in soil.

Kakaboura, A. 11 Cements in Orthodontics. https://pocketdentistry.com/11-cements-in-orthodontics/.
SOil
Soil was collected from behind Fremont dormitory (Figure 4) where a mudslide occurred in February of 2017.

Middlecamp, D. The Tribune, CA, 2020. https://www.sanluisobispo.com/news/local/article161068214.html
Methods
Producing treated mud samples
The water content of the mud samples was increased from 4.8 wt% to 20.88 wt% to match the water content used in previous years’ mud thickener senior projects. Each dental cement was mixed by hand in a glass mixing bowl with a trowel. Mud samples containing high and low concentrations of the dental cements were studied, with the high concentration corresponding to 125 grams of dental cement and the low concentration corresponding to 25 grams of dental cement. The untreated and treated mud samples each weighed 3500 grams including any added dental cement.
slope box testing
The purpose of this test was to mimic the conditions of a hillside and measure the angle at which mud begins to flow down a slope.
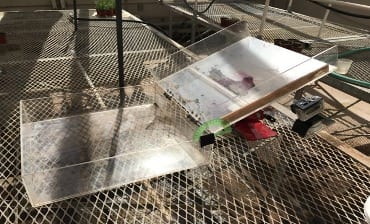
A slope box apparatus which measured 50.8 cm × 50.8 cm x 12.7 cm was built using 0.22 cm thick clear acrylic sheets. The mud was placed on the dynamic top of the box (fill side), which was attached to the stationary bottom side by metal hinges; the mud was collected in the bottom side of the slope box. A short 1.5 cm high retaining wall was added on the dynamic side of the slope box 18 cm away and parallel to the hinge axis, which guaranteed that the test was measuring the flow rate of the mud itself and not the rate of mud sliding across the acrylic surface of the box (Figure 5).
A protractor was affixed to the box’s edge to determine the minimum angle at which flow begins while manually increasing the angle of the dynamic side of the slope box from 0° to 90° at a steady rate of around 1° per second (Figure 6). A GoPro camera was put on a protruding acrylic plank along the length of the box’s fill side to record video of the mudslide. Indicators consisting of brightly-colored finger cots were placed on the surface of the mud just before flow rate testing to better track the distance the mud travels on video. The flow rate was determined using a ruler affixed to the inside border of the fill side. For each treatment, four individual trials were recorded and an average value, with a correlating standard deviation, were calculated.

Methods (cont'd.)
viscosity testing
The viscosity μ of a material is defined as the ratio of its shear stress to its velocity gradient, where alpha represents shear stress and K represents velocity gradient. The equation is written as:
μ = α/K
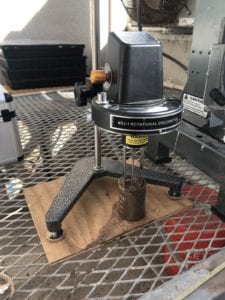
K was determined by the rotor geometry and the viscometer barrel’s rotation speed. The viscosities of all samples were measured in millipascal-seconds using a Baoshishan NDJ-1TM rotary viscometer (Figure 7).
Following slope box testing, 250 grams of mud were collected and deposited in a 100 mL glass beaker to measure viscosity. Eight replicates of mud samples were taken from each dental cement treatment and four replicates were taken from the untreated mud. The end of the thin 12.7 centimeter long metal barrel of the viscometer was dipped 6.35 centimeters into the mud sample. The torque required to resist the viscous shear stress that develops on the barrel’s surface was then measured. The viscometer has four barrels, each with a different size that corresponds to a different range of viscosities (Figure 8).
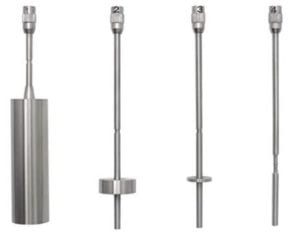
Shenzhen Aermanda Technology Co., Ltd.http://www.aermanda.com /sdp/.
Toxicity Testing
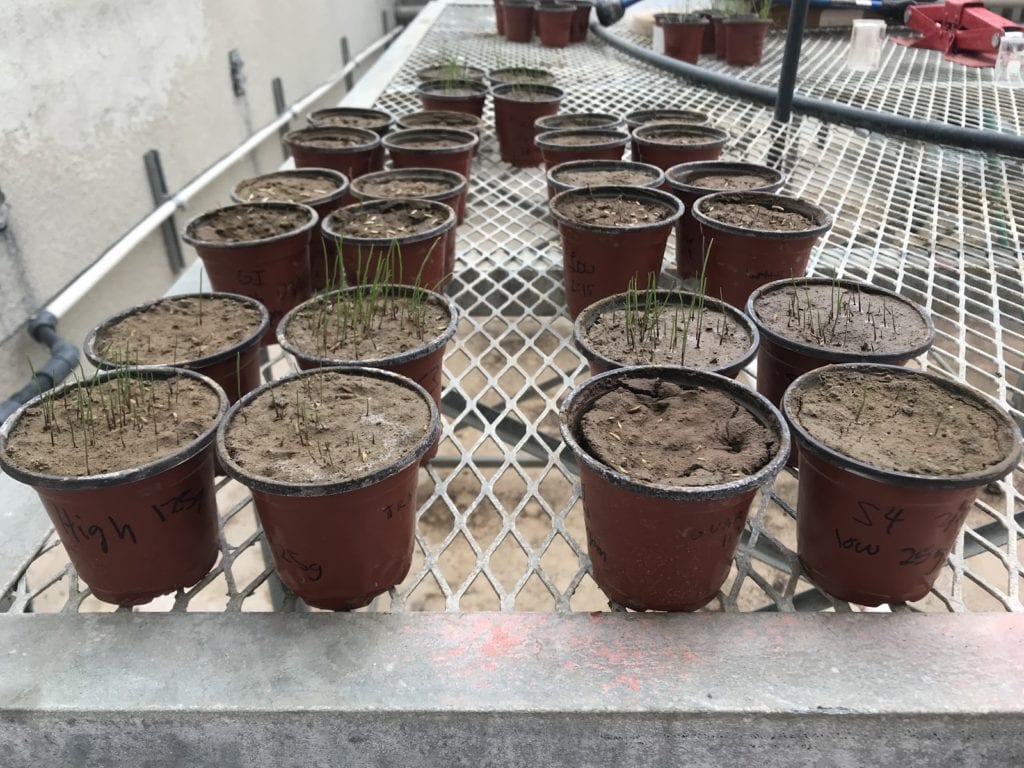
For each of the mud treatments and untreated mud, four plant pots were filled with mud after slope box and viscosity testing; this resulted in a total of 28 pots. The pots have a diameter of 4 inches and a height of 5 inches, and each one holds 250 grams of soil (Figure 9). Ryegrass is used as a proxy to determine whether dental cements are toxic; 30 seeds were placed in each pot. Ryegrass was chosen because it is simple and quick to cultivate, and it is well suited to California’s central coast.
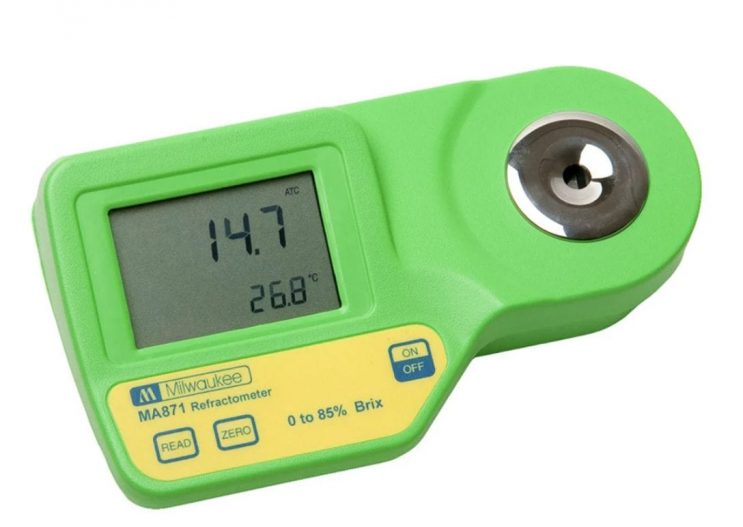
The ryegrass seeds were watered four times a week with 30 mL of water each time and permitted to grow in the greenhouse for seven weeks. The sugar content, blade length, percent germination, and biomass of the ryegrass were used to determine toxicity. The sugar content was determined by using a Milwaukee MA871 digital Brix refractometer (Figure 10). A garlic press was used to extract the liquid from the grass and a dropper was used to deposit the liquid from the garlic press to the refractometer.
Results & Discussion
flow rate
Flow rate data indicated that treating mud with dental cements reduced mudslide severity, as we hypothesized. Untreated soil produced an average flow rate of 0.51 cm/sec while the average flow rate for each of the treated soils were at or below 0.34 cm/sec. The glass ionomer dental cement appeared to perform the best of the three dental cements as a mud thickener based on slope box testing.
A one-way ANOVA test and the associated Welch’s test were used to analyze the flow rate data. These tests perform an analysis of variance by comparing the means of our seven independent groups to see if statistical evidence reveals that they are significantly different. The probability value (p-value) generated by this test is a number between 0 and 1 that represents the possibility that our data occurred by chance.
The vertical bars display all of the relative means for each treatment in the graph (Figure 11), as well as their respective confidence intervals. The letters ZP, GI, and PC stand for zinc phosphate, glass ionomer, and polycarboxylate, respectively.
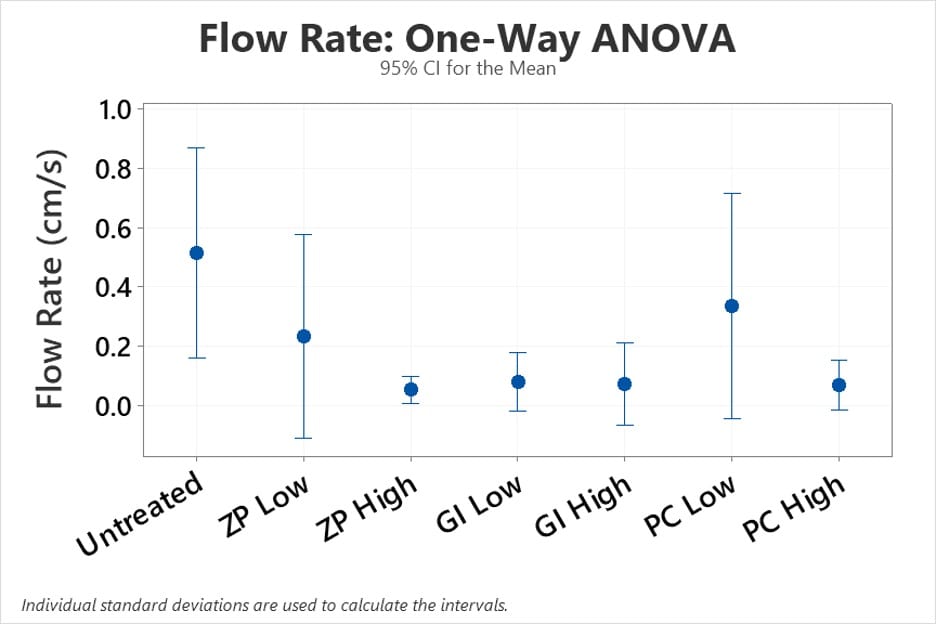
The p-value for this test was 0.067 which was higher than the significance level of 0.05, indicating that there is moderate evidence that the means are not equivalent, but not good enough to dismiss the null hypothesis at a 5% significance level. These findings suggest that we shouldn’t place too much emphasis on flow rate data when determining which dental cement is the most effective of the three.
Viscosity
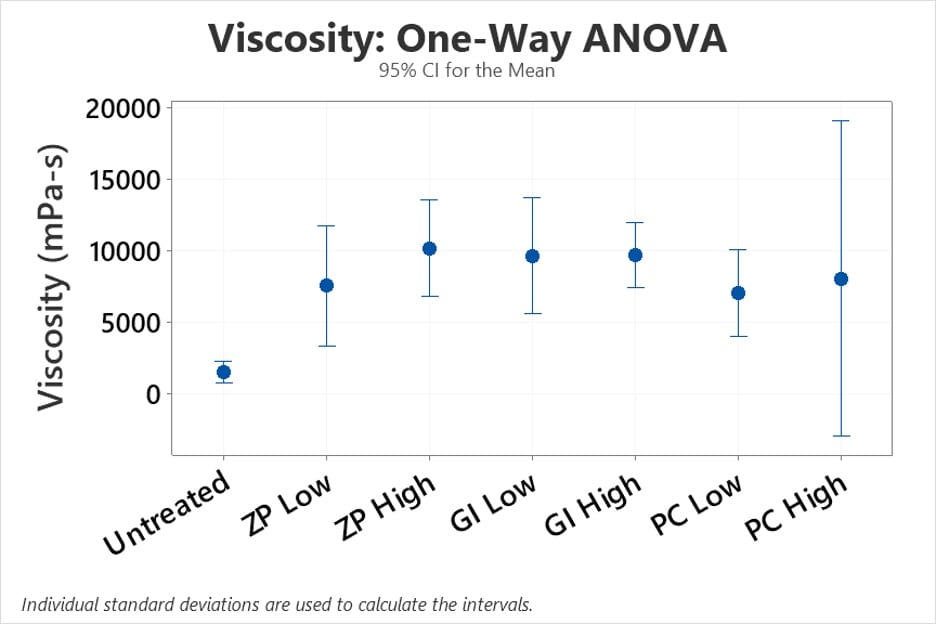
The less thickener needed to produce effective results, the better, since this requires less spending and less material used overall. Therefore, among the viscosities of mud treated with a low concentration of a dental cement, the mud treated with the glass ionomer dental cement yielded the highest average viscosity of 9650 mPa-s. This average viscosity value is comparable to that of the average viscosities yielded by the samples treated with high concentrations of a dental cement. The average viscosity of mud treated with a low concentration of glass ionomer dental cement was 550 mPa-s less than the average viscosity of mud treated with a high concentration zinc phosphate dental cement and 1583 mPa-s greater than the average viscosity of mud treated with a high concentration of polycarboxylate dental cement.
The viscosity data was analyzed statistically in the same way as the flow rate data, using a one-way ANOVA test (Figure 12) and associated Welch’s test. The p-value for this test was 0.00, which is less than the 0.05 significance level, indicating that there is substantial evidence that the means are not all equal. These findings suggest that we should place more emphasis on the viscosity data when deciding which of our three dental cement options is the most effective.
Although running numerous replicates and varying concentration amounts resulted in a more representative average value of viscosity and flow rate, it is important to note that the standard deviations associated with these average values are extremely high. They can be as high as half the value of the average, indicating that trial variance is considerable. Setting durations for dental cements might vary based on the temperature on the day the sample was manufactured and tested, resulting in either an increase or decrease in performance.
Results & Discussion (cont'd.)
The ability of dental cement to thicken is due to its molecular structure and adhesion mechanism. It is surmised that the glass ionomer forms ionic connections with the mud particles when analyzing the bonding mechanisms inherent in these dental cements. Because calcium is one of the most abundant components in soil, the glass ionomer dental cement is believed to form similar ionic bonds in this environment as it does in the mouth. Glass ionomer dental cement also contains fluorides that connect with aluminate and silicate ions to generate a glass network of connecting tetrahedra in addition to ionic connections. This may account for the glass ionomer dental cement’s superior performance as a mud thickener in comparison with the other dental cements.
Toxicity
Efficacy of mud thickeners at low concentrations is preferred because of the lower cost and lower toxicity associated with using less thickener material. Therefore examining the performance of samples with a low concentration of dental cement was of particular interest. The °Brix measurement is the same for the soils with a low concentration of glass ionomer or polycarboxylate dental cement, as shown in Figure 13. Due to its performance in average height, biomass, and sugar content, soil treated with a low concentration of glass ionomer dental cement is seen as the best choice in terms of non-toxicity when combined with the results of flow rate and viscosity measurements.
The average heights of the ryegrass grown in soil treated with low and high concentrations of glass ionomer dental cement were the tallest, and had relatively large standard deviations indicating a wide variation between blade lengths. The average height of ryegrass grown in mud treated with a low concentration glass ionomer dental cement was 5 cm taller than the average height of ryegrass grown in untreated soil. Soil treated with a low concentration of glass ionomer dental cement also displayed the highest percent biomass among the treated samples at 22.8 wt.%, compared to the 27.1 wt.% biomass of grass grown in untreated soil.
In terms of germination, it was found that lower concentrations of dental cements in the soil resulted in higher percent germination than higher concentrations. However, when watering the pots, there were some concerns with seeds being displaced to the pot’s outer boundaries when the water was poured too quickly.
Overall, ryegrass appeared to thrive best in glass ionomer-treated soil out of all the treated samples (Table I).
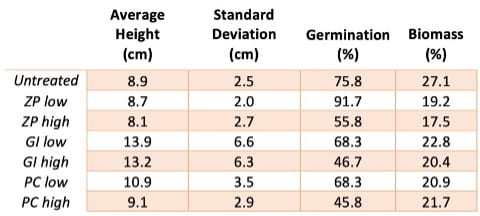
In general, a plant with a higher sugar content is healthier. Of all the treated ryegrass plants, those treated with a high concentration of polycarboxylate dental cement had the highest sugar content. Since polycarboxylate and glass ionomer dental cements each contain a much weaker acid than zinc phosphate dental cement, the toxicity of zinc phosphate dental cement is expected to be higher. As a result, the glass ionomer and polycarboxylate dental cements have the highest sugar content among low concentrations of dental cements, suggesting that they have the best biocompatibility among the dental cements studied (Figure 13).

Because less thickener used corresponds to lower cost, efficacy at low concentrations is preferred. Mud treated with a low concentration of glass ionomer dental cement is seen as the best choice in terms of non-toxicity given the average height, biomass, and sugar content of ryegrass grown in this type of treated soil.
Conclusions
After testing mud thickening properties by measuring flow rate and viscosity, glass ionomer dental cement demonstrated the best performance as a mud thickener in comparison to zinc phosphate and polycarboxylate dental cements. These measurements agreed with the preliminary literature research, which stated that glass ionomer dental cements had the greatest tensile strength, a property most closely related to bonding strength. The zinc phosphate and polycarboxylate dental cements followed as the second and third choice of dental cement, respectively, to use as a mud thickener according to their low flow rates and high viscosities in comparison to the untreated soil. With the incorporation of toxicity data, the potential use of glass ionomer dental cement as a preferred mud thickener became more robust based on analyzing the biomass, average height, and average sugar content of ryegrass grown in the treated and untreated soils. This potential solution, if implemented on a large scale, could end up saving lives and our communities from billions of dollars of damage, plus years of reconstruction time. Innovation in prevention methods is of peak importance within the realm of natural disasters and we hope this project inspires like-minded solution thinking.


GLASS IONOMER
ZINC PHOSPHATE
POLYCARBOXYLATE
Recommended Future Work
If the project is replicated or modified with other mud thickeners, there are some improvements that could be made:
- Accelerometer – Mud flow rate was measured by analyzing GoPro footage and using a ruler to measure the distance the indicators flowed. However, measuring the distance the indicator travels along the surface of the box varies with factors like nonuniform sliding across the sample length or the subjective perspective that the viewer has of the video. Therefore, a more precise measuring device such as an accelerometer would be helpful to measure the flow rate.
- Change video camera – To gain more accurate flow rate readings, using a camera that does not display a fisheye perspective would be recommended, as it distorts the alignment of the indicators in relation to the ruler.
- Surface roughness – Changing the smooth surface of the slope box fill side to a rough surface to help the mud flow over itself instead of sliding along the acrylic surface is recommended.
- Climate/light controlled testing environment – To eliminate the factor of heating from the sun causing fast setting times and potential evaporation of moisture from the mud, tests could be conducted at night or in a climate – and light – controlled location. The greenhouse used in this study is equipped with light fixtures so testing at night is a readily available option.
- Watering method – When watering the pots of ryegrass we noticed that if the full amount of 30 mL was all added at once it would flood the pot and cause the seeds that were on the surface of the soil to float to the top of the water, then subsequently drift towards the edges of the pot. This caused the grass to grow at the edges instead of the middle. To avoid this effect, the 30 mL of water needs to be added in incrementally to allow the water to absorb into the soil. If the 30 mL is broken into 5 increments of 6 mL each, this will allow enough time to mitigate this effect.
- Uniform distribution – Instead of using a bowl where the cements may not be reaching the full depth of the sample, it is recommended that a shallow pan be used for mixing to ensure more uniform distribution of the cement in the mud.
- Time effects – Dental cements have setting times that can range anywhere from 2 minutes to 24 hours. Therefore, if flow rate and viscosity measurements were taken immediately after mixing and again at several hours after the mixture was made, these values could be compared to see if time affects the thickening ability of any given dental cement.

This project is sponsored by Cal Poly's Materials Engineering Department
Flow Rate Videos
Flow rate of an untreated soil sample and a low concentration glass ionomer sample. The flow rate values are calculated by tracking the distance the pink indicator moves in reference to the ruler over time. Resulting rates of these specific trials are 0.85 cm/sec and 0.04 cm/sec, respectively.

