Our Team
=

Michaela Fromm
Project Manager
Michaela Fromm is an Industrial Engineering major, Statistics minor, and Engineering Management Master’s student from San Juan Capistrano, CA. Her main roles were designing and analyzing experiments for the final dashboard designs.

Sascha Keir
Communications Lead
Sascha Keir is an Industrial Engineering major from Toronto, Canada. Her main roles were facilitating time studies and coordinating the dashboard implementation.

Emily Johnson
Data Analyst
Emily Johnson is an Industrial Engineering major and Engineering Management Master’s student from Marin County, CA. Her main roles were developing standardized excel templates and designing the Power BI dashboards.
Acknowledgements
We would like to thank Dr. Liz Thompson and the SLO County Behavioral Health Department including our sponsor Irma Perez who guided the team throughout the project.
Our Project's Videos
Please enjoy the team’s final presentation and walkthrough of the external dashboard.
Our Project's Digital Poster
Problem Statement
San Luis Obispo County Behavioral Health collects data on treatment programs, but they do not have proper means of analysis to aid in informed decision-making. The current data recording process lacks uniform structure and employees have minimal data analytics skills. This inhibits the department from receiving optimal grants biannually and properly informing taxpayers on county health status monthly.
Objectives
Create and implement internal and external data visualization tools that:
1. Aid the department in displaying useful statistics for grant writing
2. Ensure the public has transparency about the programs and use of their tax money
3. Be an example for other Health County to implement similar visual data tools
Current State
The current process is done through Excel:
- – The 5 different programs use 5 different non-uniform, static spreadsheets
Time Study Results:
- – One statistic takes 5.1 minutes on average to calculate
- – One grant has approximately 50 statistics, average grant time = 256 minutes or 4.3 hours
Areas of Research
- Dashboard Design
- Dashboard Usability
- Software Analysis: Tableau vs. Power BI
- Public Health Dashboards
- Adult Drug Courts
- Social Impact of Substance Abuse Programs
- Analytical Hierarchy Process – AHP
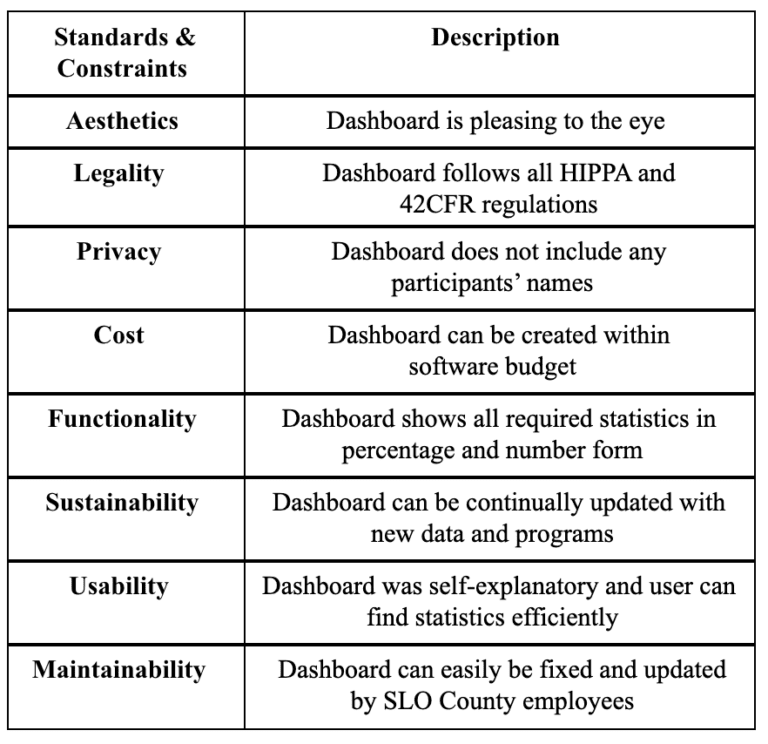
Standards & Constraints
Impact Analysis
- – Improved transparency for public
- – Reduced cost for taxpayers
Societal Impacts:
- – Reduce recidivism rates
- – Decrease crime and drug use
- – Keep families together
- – Low-level offenders receive treatment inside of prison time
This project is sponsored by San Luis Obispo County Behavioral Health Department.
Experiments
External Dashboard
Examined effectiveness of user-centered design principles through quantitative and qualitative methods.
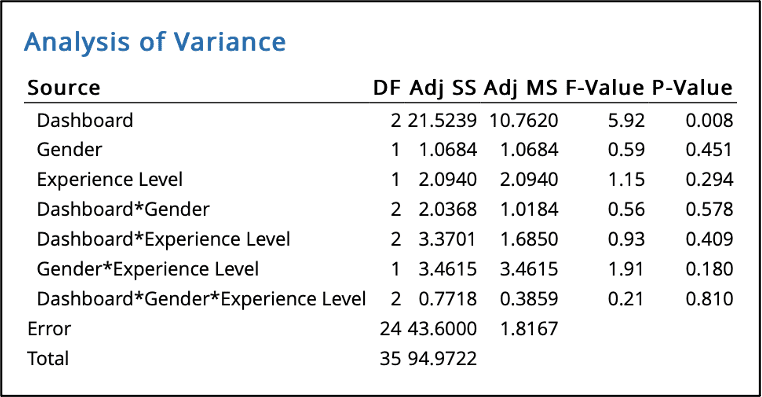
Found significance difference in number of clicks for each dashboard at the .01 significance level.
Internal Dashboard
Conducted a focus group of employees for feedback and critiques of different dashboard iterations.
Results
Create a hybrid dashboard with both tables and graphs.


Excel Standardization
Designed standardized excel templates with uniform headers and drop-down menus for data entry. Linked the drop-down menus to one template that can edited in the future. Created excel workbooks templates for new programs that will be added in the future.
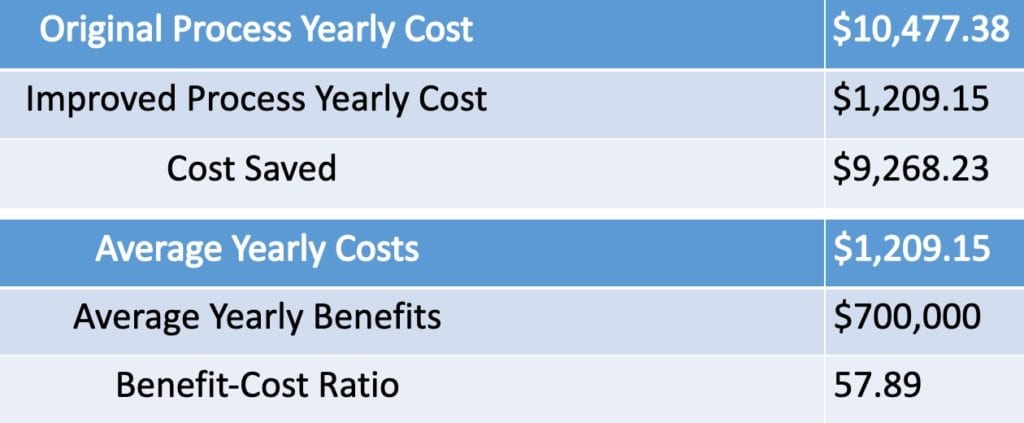
Verification & Cost Savings
Verification
Time to find one statistic improved from 5.1 minutes to 14.8 seconds
Time to complete one grant application went from 4.3 hours to 12.3 minutes, a time savings of 95.2% for each grant application.
Cost Savings
Final Designs
External Dashboard

- – Educate the public
- – Display statistics including participant gender, race, age, drug of choice, and number served per year
Internal Dashboard

- – Help employees gain insight and analyze data for grant writing
- – Includes statistics for all data the county is collecting in both visual and table format
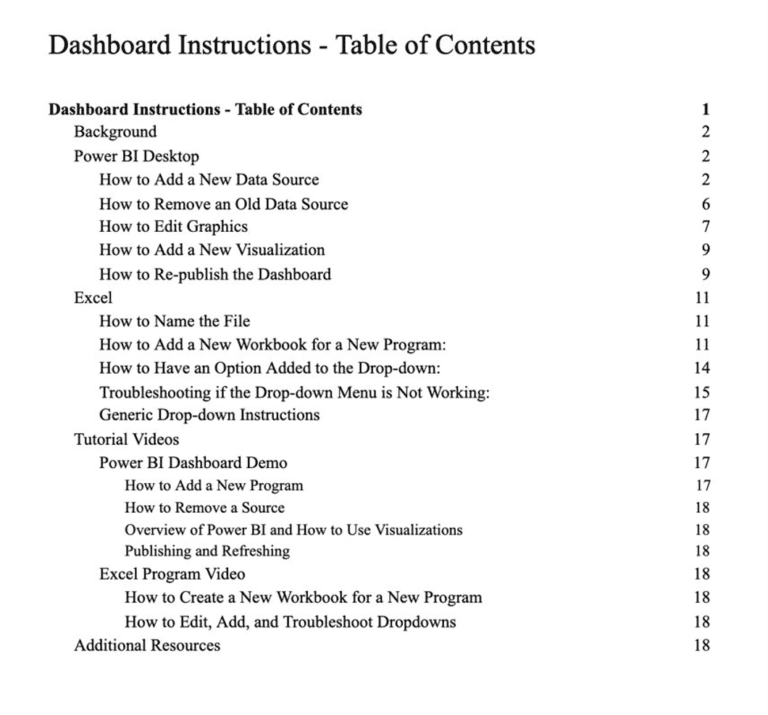
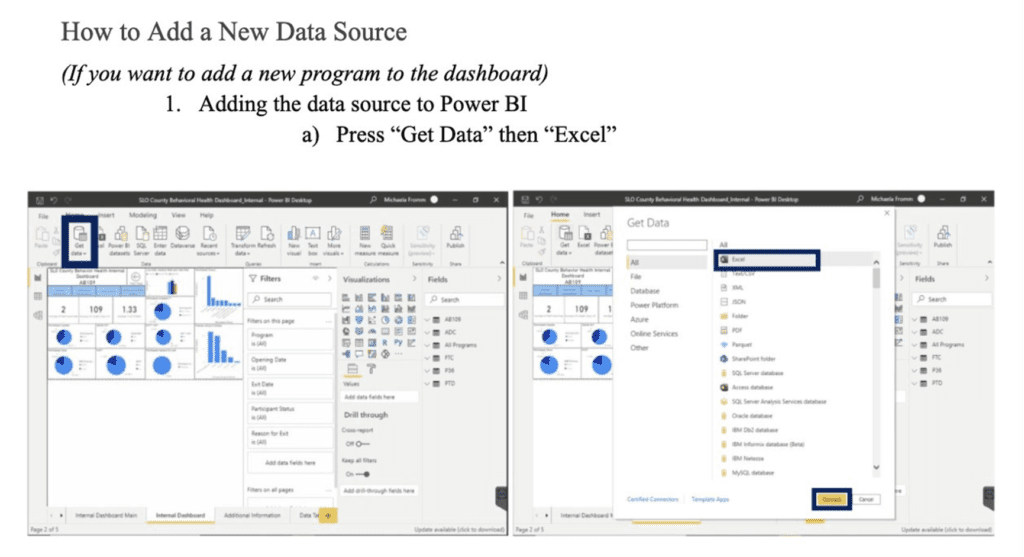
User Guides
Conclusions
Implementation Plan: Train employees on new Excel template and Power BI dashboards
Future Directions: More extensive Power BI training and creation of a data analytics team
Scalability Options: Solution can help other counties create similar dashboards as dashboards for Health Departments will be mandatory starting Spring 2021
Our Project Slides
- Follow this link to view the external dashboard on the SLO County Behavioral Health Department’s website.

