Sonoma EMS Process Improvement

Sonoma County’s EMS is serviced by a number of public ambulance providers and the company AMR. Ambulances have an average response time of 7-9 minutes depending where they are responding in Sonoma County. Different regions of the county constitute compliance areas, and each area has a set response time standard. Failure to meet these standards routinely costs AMR $30,000-$50,000 per month in compliance fines while delaying delivery of critical medical care to the patient. By outlining the EMS process and modeling it in a simulation program our team gained important insights in ways to improve response times.

Our Team

The team consists entirely of Industrial engineering majors. Each team member was motivated to take on this EMS process improvement project for Sonoma County due to a variety of different reasons. However, we found commonality in our passion for process improvement, as well as the prospect that the solutions could have a real-world impact by helping to provide better quality emergency medical care to others.

Lianne Dooley

Simulation design lead

Liane is a fourth-year Industrial Engineering major at California Polytechnic State University in San Luis Obispo. She will be completing a Bachelor of Science in December of 2021, and following that, hopes to work in public works or transportation.

William O'Brien

Process improvement lead

William is a fifth-year Industrial Engineering student at California Polytechnic State University San Luis Obispo. He will be graduating with a Bachelor of Science in August 2021. After graduation he hopes to work within engineering sales or within a process improvement role within the public or government sector.

Kaitlin Groleau

Project manager

Kaitlin is a fourth-year student at California Polytechnic State University, San Luis Obispo completing her Bachelor of Science in Industrial Engineering. In June 2021, Kaitlin will gain work experience at Applied Materials as a Manufacturing Engineer for a co-op. Upon completion, she then will be continuing her time at Cal Poly SLO and completing her masters in Engineering Management.

Alessandra Chuquillanqui

Impact analysis lead

Alessandra is a fourth year Industrial engineering student at California Polytechnic State University, San Luis Obispo. After her two co-op experiences, she is very interested in process improvement, data analysis and entrepreneurship. She will be receiving her Bachelor of Science degree this upcoming Fall Quarter 2021 and she hopes to get a full-time job in the tech industry.

Acknowledgements

The EMS Process Improvement team would like to express our deepest gratitude to our sponsor, Doug Williams, for the opportunity, as well as the commitment, dedication, and guidance he has given us throughout the length of the project. Many thanks also go out to Ken Reese and James Salvante, for taking the time to provide us with their insight and experience relating to this project, and to Alessandro Hill, for his invaluable help in developing the model used to test our final solutions. Finally, we would like to thank Jill Speece and Tali Freed for all their guidance and support in this project.

Sonoma County EMS Process Improvement Presentation

The YouTube link below will redirect you to a presentation outlining the process background and the logic used to formulate our proposed solutions.

Play Video

Our Project's Digital Poster

Project Scope

The EMS process has an extensive scope with many changing aspects and decisions. The team worked with their sponsor, Doug Williams, to fully grasp the system in order to find out where the team’s effort might yield the most benefit.

Terminology

AMR:

American Medical Response. Founded in 1992 to deliver a number of services to communities nationwide, from managing emergency medical systems to coordinating private-public partnerships that best serve an area’s needs.

EMS Agency:
Emergency Medical Services responsible for the operational components of each county’s portion of the EMS system including oversight and review of the ambulance providers.
 
REDCOM: 

Redwood Empire Dispatch Communications Center. Provides centralized Emergency Fire and EMS dispatching to emergency response agencies within Sonoma County.
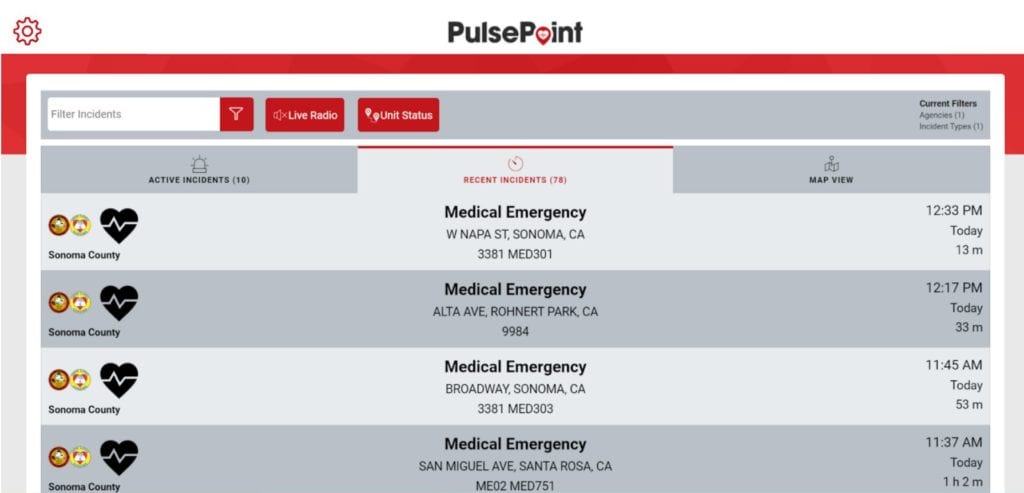
Response Time:

Defined by the team as the time it takes for an ambulance to arrive to a call from the time the call was received. 

9-1-1 Process FlowChart

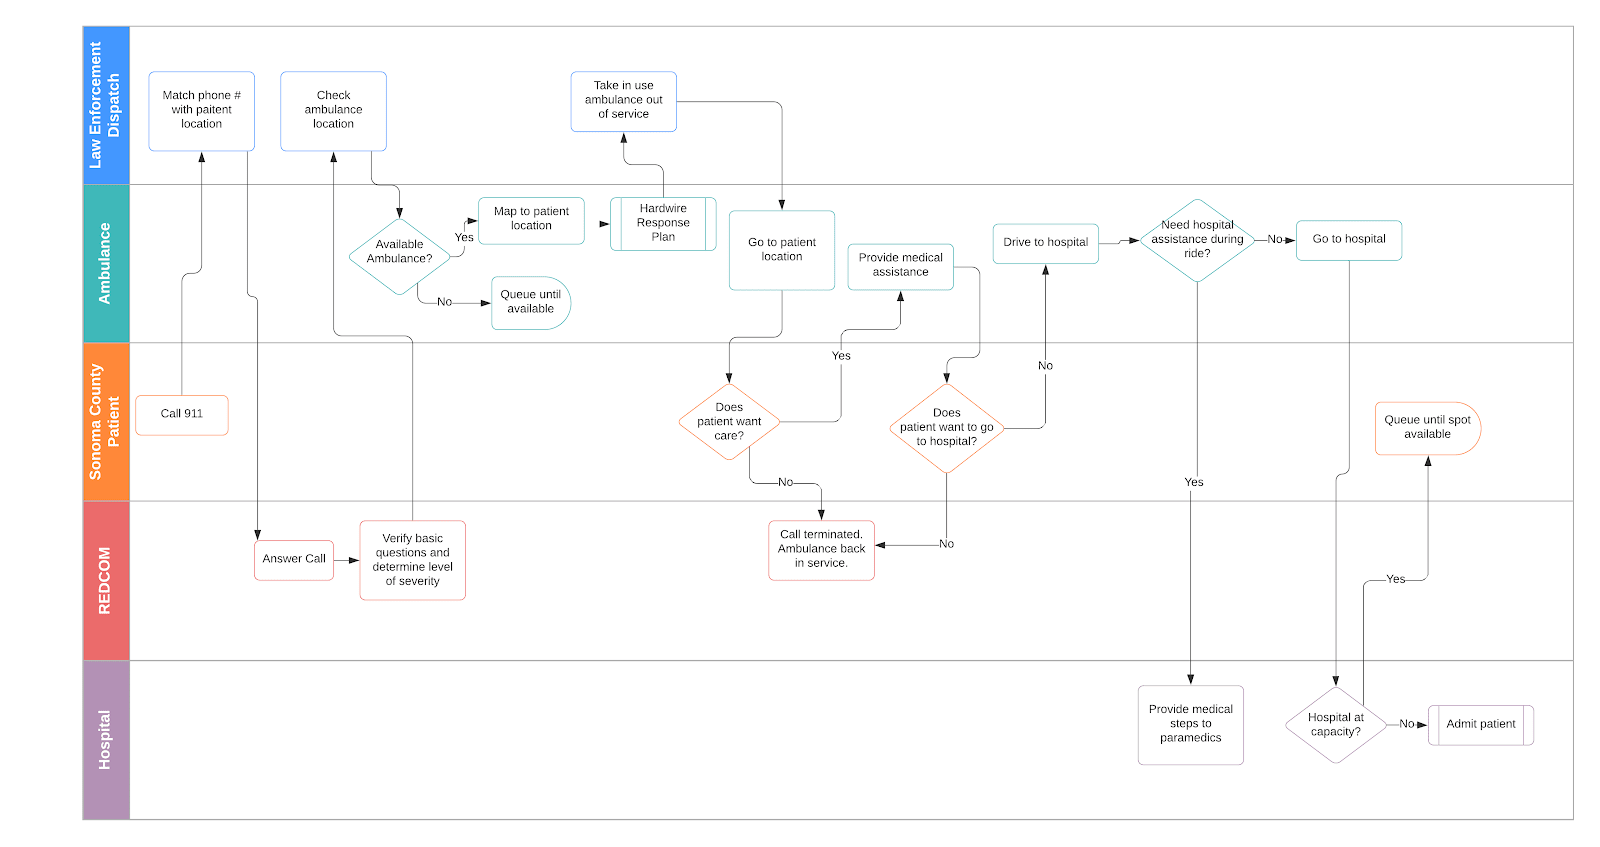
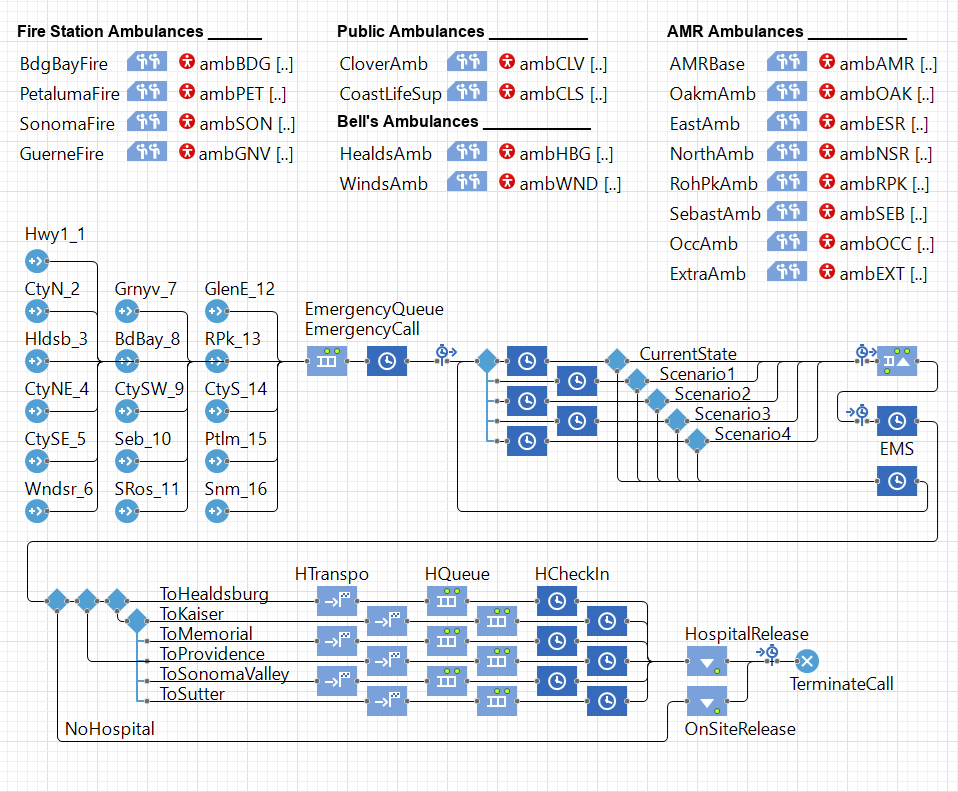
The process flowchart above exhibits the 9-1-1 call and dispatch procedure. The team was able to narrow the scope on specific areas to improve ambulance response time.

cause-and-effect diagram

The team created a cause-and-effect diagram to analyze why ambulance response times might be slower than optimal. Areas of analysis included ambulance distribution and activity level, as well as communication and collaboration between ambulances and hospitals. This also assisted the team in brainstorming feasible proposed solutions.

key performance indicators

1.  Ambulance Response Time — 7 to 9 minutes

2. Ambulance Utilization — 15 ambulances during the day

3. Ambulance Dispatch Time — 45 seconds

4. Compliance Fines — $30,000-$50,000

Key performance indicators (KPIs) are a type of performance metric to evaluate the success of the project. 

Literature Review

To establish the importance of the project, the team looked into impact of ambulance response time on patient outcomes, and found there are instances in which a prompt EMS response correlates with a much better patient outcome, including reduced mortality.

–In a comprehensive study of emergency cardiac events it was found that the average EMS response time for non-survivors was 9 minutes whereas for survivors the average was 8.5 minutes. – (Stoeckl, 2010)

–“Unexpected survivors” were also found to average significantly shorter out-of-hospital time than unexpectedly died. – (Feero, 1995)

Data Collection

Data was obtained from a public non-profit foundation that helps public safety agencies engage their citizens and receive alerts on calls being responded to, called PulsePoint. 

Pulsepoint

Over the span of two weeks, the team manually input the time, location, and (when available) duration of calls in Sonoma County.

area distribution

Data was sorted into sixteen areas (created by the team) per hour over the span of one week. Pivot tables were generated and Poisson distributions were created for each area. The distributions were then used later and inputted into the simulation model.

daily call distribution

The calls per week were uniformly distributed, averaging 127 calls a day within Sonoma County.

Proposed Scenarios

Through Multiple Criteria Decision Analysis (MCDA), the team decided on solution designs that fit the scope and feasibility of the project with minimal bias.

Scenario #1: Increase Number of Ambulances

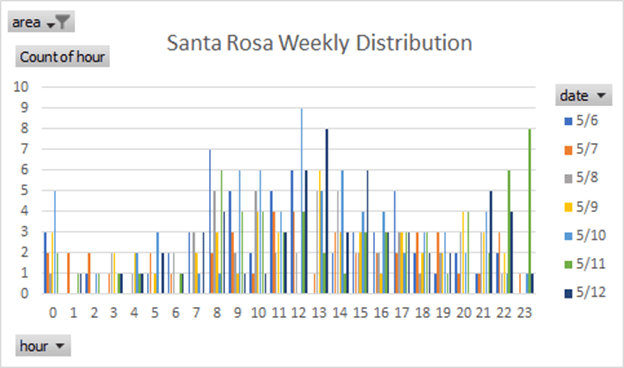
The team wanted to investigate whether adding an additional ambulance to AMR’s ambulance fleet would improve average response times. To do so, a 16th ambulance with a staging base near one of the highest call volume areas, Santa Rosa was added.

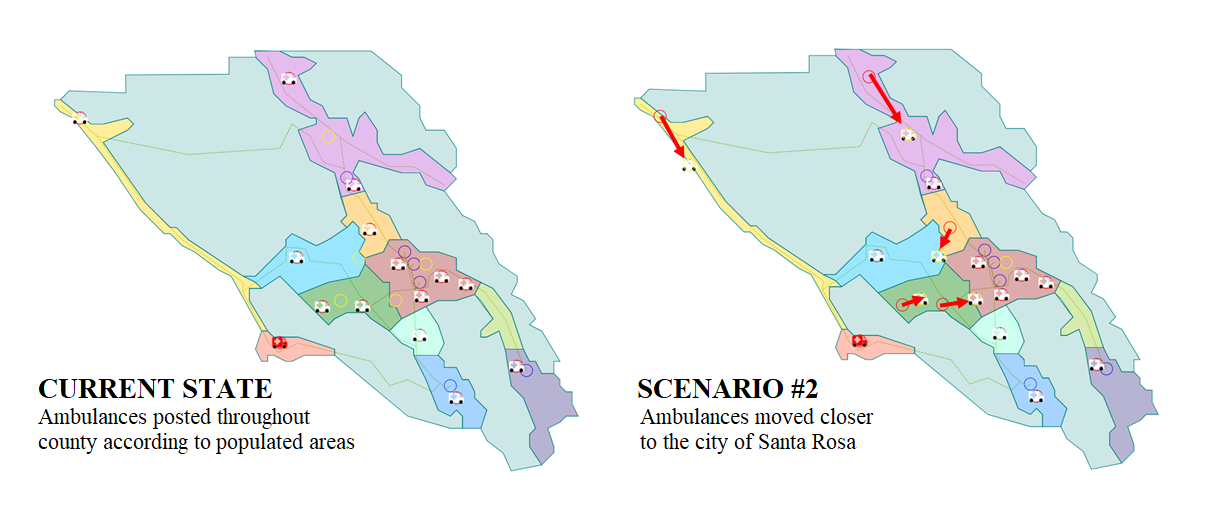
Scenario #2: Shift Ambulance Postings

The second solution involved the question of whether updating the location of standardized ambulance posting locations could decrease the average response time. For this solution, the team moved five of the existing ambulance posting locations closer to Santa Rosa.


Scenario #3: Keep Assigned Ambulance in Bodega Bay

The third solution involves a specific ongoing political discussion with Bodega Bay about relocating their ambulance. Due to its status as a tourist attraction as well as its remote location relative to the rest of the county, Bodega Bay wants to keep its only ambulance geographically close. This scenario prevented the Bodega Bay ambulance from servicing emergencies that did not originate in Bodega Bay.

Scenario #4: Increase Number of Ambulances and Shift Postings

This solution combined Scenario #1 and #2 by adding a sixteenth ambulance and repositioned five ambulances postings closer to Santa Rosa emergencies. 

Simulation

The development of a simulation model served as solution for Sonoma County to do ongoing analysis as well as test the team’s four solution scenario designs.

The model consists of two key components: the model logic and model visualization.

model logic

The simulation was designed using the program AnyLogic due to its graphical interface, scalable design features, and programmable variability. 


Below is the ambulance model logic and flowchart.

At the top of the model are ambulance posts which designate an ambulance to each base through a Javascript function.

There are sixteen source blocks (generating emergencies in each of the sixteen areas of the county). Each emergency must pass through a 9-1-1 call (EmergencyQueue and EmergencyCall) and then, depending on which solution is being tested, is assigned to one of the ambulances via another Javascript function (which returns the nearest idle ambulance).

An ambulance is sent to the location of the emergency, and after a suitable delay, either departs the scene or takes the patient to the nearest hospital. 

model visualization

The model visualization consisted of a to-scale map of Sonoma County, which the team divided into sixteen “areas”, each programmed to generate a certain number of emergencies per day. Also, added to the visualization, were ambulance postings (the red and yellow circles) and six county hospitals capable of receiving ambulances (the blue circles).

Ambulances were represented in the model as well, and emergencies were shown as blinking red dots. Due to our interest in modelling the Bodega Bay ambulance’s utilization, we colored that ambulance red. 

Model Parameters

Scale

The scale of our model was determined using a to-scale Google maps image of Sonoma County.

Number of Ambulances

Based off information provided by EMS Coordinator, James Salvante, the team determined that the numbers of ambulances used on a daily basis varies widely with the time of day or season, but the team verified that using 15 ambulances was a reasonable assumption for a daily average. 

Ambulance Response Zones

Ambulance response zones were arbitrarily defined by the project team to encompass 16 different regions of high call volume. 

Zone Travel Speeds

The zone travel speed is the speed that the ambulances move through a zone. Because of an ambulance’s ability to respond with lights and sirens, which allows them to ignore most normal traffic laws, the team assigned standard speeds of 65 mph for all zones. 

Ambulance Staging Zones

Ambulance staging zones were programmed into the model for ambulances to start and end a call from. The zones represent a geographical area in which the ambulance would wait for dispatch to send them to a call.

Hospitals

There are 6 hospitals in the county that are capable of receiving ambulances and the locations are modeled based off the guidance given to us by our sponsor

Results

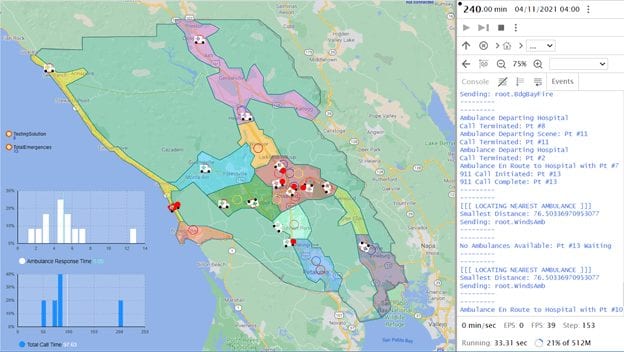
To test the simulation, twenty trials, each lasting twenty-four hours of simulation time were run per scenario. The number of emergency calls, average ambulance response time, average call duration, and utilization of each individual ambulance were recorded.

Current State:

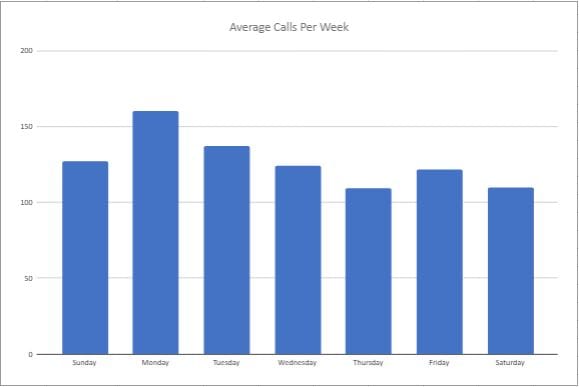
— Average of 124 calls

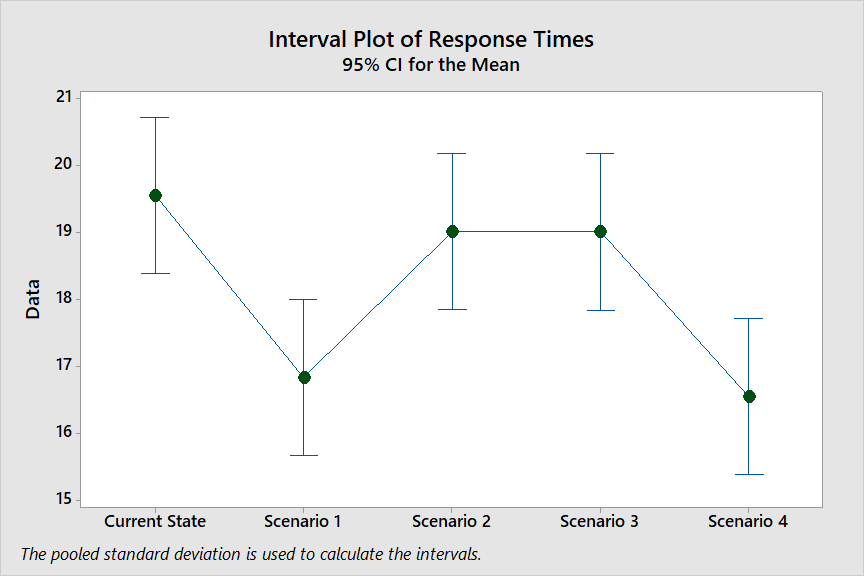
— Average response time of 19.6 minutes

— Average call duration of 138 minutes.

Six of the fifteen ambulances in use saw utilization rates over 0.80.

Scenario #1 Results:

— Average of 121 calls

— Average response time of 16.8 minutes

— Average call duration of 124 minutes

Statistical analysis of the decrease in response time from the current state determined a 95% confidence interval of (1.083, 4.357), or an estimated 2.72 minutes (or 13.8%) improvement. The team also noted that overall ambulance utilization decreased: none of the ambulances exceeded an average utilization of 0.80.

Scenario #2 Results:

— Average of 122 calls

— Average response time of 19.0 minutes

— Average call duration of 131 minutes

This was not found to be a statistically significant improvement.

Scenario #3 Results: 

— Average of 119 calls

— Average response time of 19.0 minutes

— Average call duration of 135 minutes

This was likewise not a statistically significant improvement on response time. 

In addition, the Bodega Bay ambulance’s utilization was reduced from 0.66 to 0.06

Scenario #4 Results: 

— Average of 121 calls

— Average response time of 16.6 minutes

— Average call duration of 126 minutes

Statistical analysis of this decrease in response time, compared to the current state, estimated a decrease of almost exactly 3 minutes, or a 15.3% improvement. The confidence interval for the difference in time was (1.289, 4.712).

Recommendations

The team recommends:

1. Increasing to 16 ambulances.

2. Shifting ambulance postings closer to Santa Rosa.

3. Allowing Bodega Bay to continue to service emergencies in surrounding cities.

Impact Analysis

Triple Bottom Line:

The triple bottom line is an accounting framework with three parts: profit, people, and planet. The recommended potential solutions have social, environmental and financial benefits that must be taken into account when determining the final solution.

The interconnection of the elements of the Triple Bottom Line concept. | Download Scientific DiagramEconomic Analysis:

The team accessed Sonoma County’s Comprehensive Annual Financial Report (CAFRs), which provides financial professionals with a complete look at the county’s finances. The team then evaluated the county’s income statements, available from 2016-2020, and forecasted the year 2021. For the first recommendation, the team drafted two six-year P&L statements that considered purchasing the ambulance unit under two scenarios: straight line depreciation or expensing the unit in year one. The initial cost of an ambulance was estimated at $90,000 with loans and grants used from government and county support.

The team’s goal is to choose a scenario that would better reflect the financial stability and profitability of the county of Sonoma. Therefore, if Sonoma County were to choose this as a final solution, it would expense the cost of the ambulance unit in year one.

Patient Care:

The primary goal of EMS is to provide quality patient care. Therefore, for all potential solutions, the team made sure all ambulances within the system could continue to supply help and resources to the emergencies happening around Sonoma County for a positive impact on  both residents and tourists.

Equity:

Area creation is an important ethical aspect of the simulation model. Currently, Sonoma County is broken up into areas based on political views and voting zones. Consequently, the team created 16 unbiased areas that are reflective of frequency of calls and represent equity of patient care to the citizens of Sonoma County. 

Sustainability:

All the potential solutions have been developed with the ultimate goal of being sustainable every step of the way. Recommendation #2 could be performed with a minimal cost and relatively easy upkeep. On the same note, Recommendation #1 and #2, are long-term positive impact projects that will reduce the amount of waste generated.

Share

Share on facebook
Share on twitter
Share on linkedin