Void and Density Analysis of Cyanate Ester Composites
Materials Engineering, Spring 2021
In large scale composite manufacturing, voids and their frequency within prepreg materials play an important role in predicting the mechanical properties of a final composite laminate. The industry standard process for determining voids in composite materials is through resin digestion and resin ignition via ASTM D3171. One limitation to this standard is its ability to frequently produce negative void volume values in quality control testing, due to the
calculation sensitivity of input resin and fiber densities. For this reason, Toray Advanced Composites wanted to investigate the process steps of ASTM D3171 to determine if discrepancies in resin density data may be leading to negative void volumes in their EX-1515 cyanate ester resin system. In order to analyze the matrix density, three groups of materials were investigated including: neat EX-1515 resin, EX-1515/CN-60 composite, and EX-1515/Astroquartz composite. All three materials underwent dimensional and specific gravity density measurements, in addition to optical microscopy. In combination with data from resin ignition and digestion, the density data revealed that original assumed density for EX-1515 was lower than the actual density of the resin system, which led to the prevalence of negative void volume calculations. Furthermore, the results of the project revealed the importance of there being a range of density values for composite resin systems due to the high sensitivity of the process steps and calculations found within ASTM D3171.
A bit about me
This is my fifth year as a materials engineer in the Cal Poly MATE Department. I’m originally from the Bay Area, growing up in Lafayette, CA. During my time at Cal Poly, and my year-long exchange at Chalmers University of Technology in Sweden, I’ve taken a strong interest in polymer and composite materials. This was a big reason why I took on my senior project with Toray Advanced Composites.
Outside of class I’ve spent a majority of my time working with composites while on the Cal Poly Racing – Baja Team and researching more bio-derived polymers while in Sweden, both allowing me to get hands on experience in topics that I’m passionate about.
Acknowledgements
I would like to thank the following people for their guidance and support throughout my senior project:
Russell Kirkman – Toray Advanced Composites
Wyatt Taylor – Toray Advanced Composites
Prof. Blair London
Eric Beaton
My Cal Poly Peers
My Project's Digital Poster
Background
Polymer matrix composites
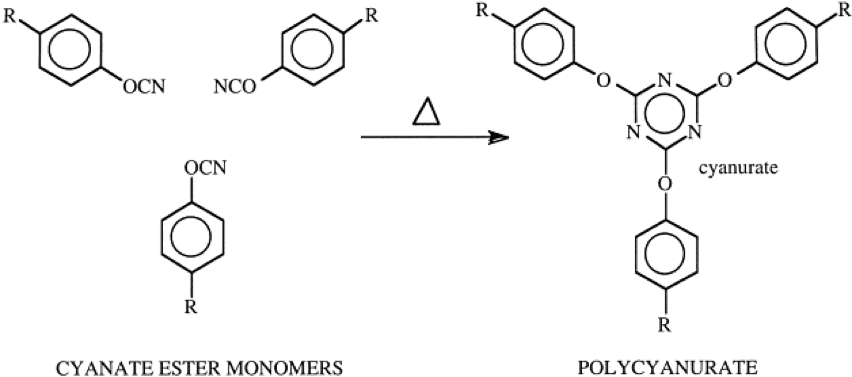
Polymer matrix composites (PMCs) were first seriously researched during the World War II, as aerospace engineers searched for materials of higher specific strength and stiffness than traditional metal alloys. Fast forward to the 1990s, cyanate ester (CE) resins started to increase in popularity and prevalence in the composites industry. Their use in the aerospace market is due in large part to their balance of high mechanical and thermal properties, in addition to low water absorption. These factors contribute to a high dimensional stability that is important for air and spacecraft that see large thermal cycling during flight. The dimensional stability is due to the structure of the resin because unlike more commonly used epoxy resins, cyanate ester resins polymerize through trimerization and form cyanurate groups instead of hydroxyl groups (Figure 1).
Figure 1. Example of a trimerization reaction occurring with cyanate monomers as they polymerize during a cure cycle.
Voids in Composite Materials
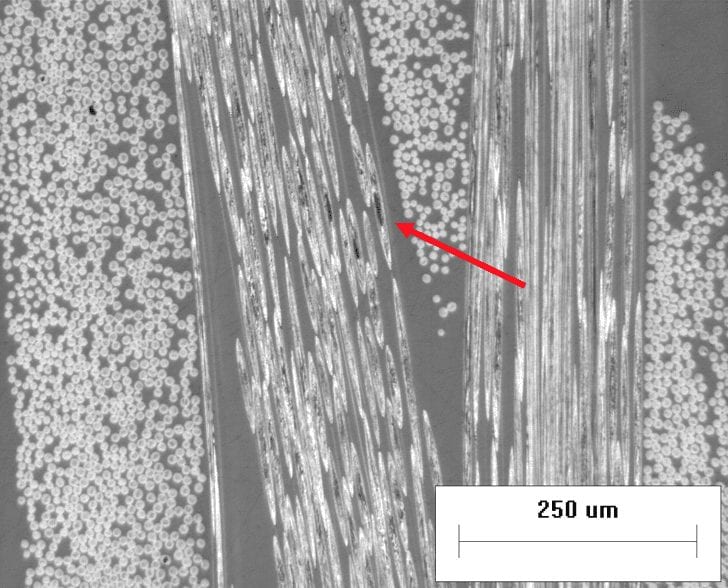
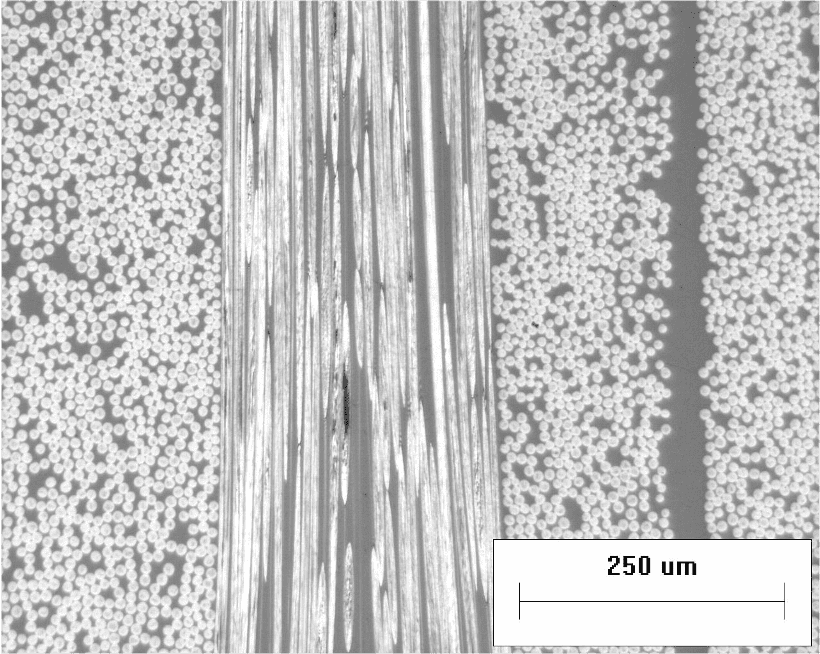
Due to the exceedingly demanding requirements for composite components in the modern aerospace and automotive industries, the quality of the materials in use must remain high by keeping the amount of material defects to a minimum. Of the many possible defects that could form during a composite layup, some of the more common are: voids, ply delaminations and matrix cracks. Each of these defects are points of concern to engineers and can undermine the integrity of structural components. Of the three, the identification and measurement of voids is a particularly difficult but important process. Voids are formed from air or chemical vapours that are trapped during the manufacturing of pre-impregnated fabric or trapped between layers of pre-impregnated fabric during component production (Figure 2). One of the more common methods that composites manufacturers use to quantify the number of voids in a composite material is with ASTM D3171.
Figure 2. 100x magnification micrograph of a polished composite sample with visible voids between reinforcment and matrix (red arrow).
ASTM D3171
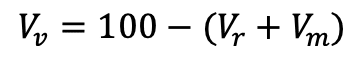
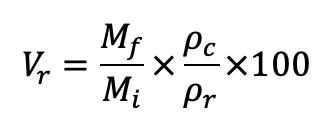
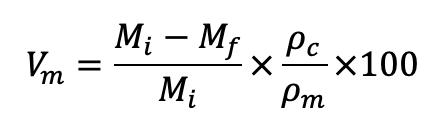
The standard ASTM D3171 – Standard Test Methods for Constituent Content of Composite Materials, plays a critical role in understanding the amount of voids within in a composite material. With the exact fiber content obtained from either resin ignition or resin digestion, in addition to the sample density and constituent density, the void volume in a composite sample can be calculated. Equation 1 calculates the final void volume for a given composite sample, but requires the reinforcement volume fraction of Equation 2 and the matrix volume fraction of Equation 3. Equation 2 takes into account the mass fraction of the reinforcement which is calculated by dividing the final mass of the processed fibers by the initial mass of the composite sample. The value is then multiplied by the ratio of composite density over reinforcement density. Equation 4 multiplies the resin mass fraction by the ratio of composite density over the resin/matrix density.
Equation 1
Equation 2
Equation 3
One limitation to this process is that the calculation of voids is quite sensitive to small discrepancies in the stated densities of the composite matrix and is known to occasionally produce negative values for the void content. This possible error is often overlooked due to the relative speed and simplicity of the measurement method. A incorrectly low resin density would explain erroneous negative void values, based on how the resin density interacts in Equation 3, and thus Equation 1. Looking at how resin density is in denominator of Equation 3, a low resin density would artificially inflate the term. An artificially inflated term could then combine in Equation 1 to equal more than 100, and thus produce a negative void volume.
Problem Statement
The current issue involves the repeated calculation of negative void volume values in quality testing of cyanate ester matrix composites. Available literature on the topic of void measurement states that obtaining negative values can be a result of the calculation sensitivity found in ASTM D3171 for the input values of resin densities. To determine what exactly is the causation, the proposed senior project will analyze the density of Toray’s EX-1515 cyanate ester resin and process steps involved with measuring voids in composite components. Based on the collected information, a credible justification will be formed for the erroneous values. The specific goals of the project will be to recalculate the densities of each input material, analyze the fiber-matrix interface and conduct void content measurements in an attempt to replicate company processes. Testing methods and analysis techniques that will implemented to accomplish the project goals are: ASTM D3171, ASTM D792, dimensional density measurements and optical microscopy. The composites that were tested consisted of Toray’s EX-1515 cyanate resin system incorporated with Astroquartz silica fiber and GRANOC CN-60 carbon fiber.
Toray Advanced Composites
Project In Partnership With
Measuring Resin Density
To determine if Toray’s previously assumed EX-1515 resin density is accurate or not, two different density measurement methods were conducted.
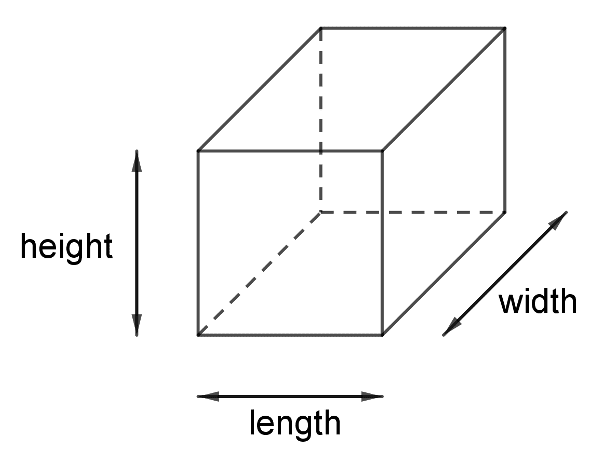
The dimensional method was a straightforward process for obtaining material density prior to conducting ASTM D792. The process involves measuring the average height, length and width of a sample, in order to establish the volume of the sample (Figure 3). The mass of the sample was then divided by the calculated volume of the sample in order to determine the density. Approximately 20 samples of each composite and 40 plain EX-1515 samples were tested.
Figure 3. Schematicc of volume calculated for the dimensional method.
To supplement the density results of the dimensional method, all the composite and neat resin samples were measured again in accordance with ASTM D792 – Standard Test Methods for Density and Specific Gravity of Plastics by Displacement. The same standard is used by Toray to measure density in their testing lab. The standard uses a process called the Archimedes’ method or specific gravity method, which measures a sample’s mass in air and mass in water to calculate the specific gravity and density of the sample (Figure 4).
Figure 4. Schematic illustrating the Archimedes’ method for calculating density with the sample mass in air and mass in water.
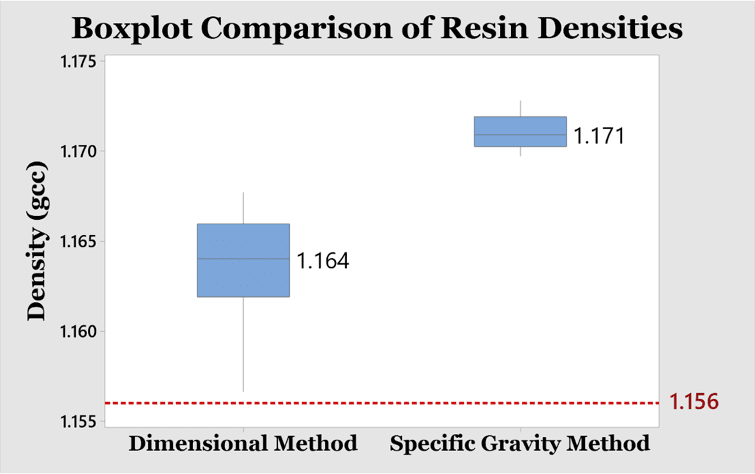
Toray’s initial suspicion with resin density was that their previously stated EX-1515 density of 1.156 g/cm3 was too low. This would be contributing to Toray’s repeated negative void volumes. The results of the dimensional method and specific gravity method served as a strong sign that Toray’s previous accepted value was incorrect. The boxplot of the resulting measured densities reveals that the averages from both methods were significantly higher than the previously assumed value of 1.156 g/cm3 (Figure 5). Even with the spread in results, the difference of average densities from 1.156 g/cm3 to 1.164 g/cm3 to 1.171 g/cm3 is significant in the realm of material densities of composites. These results give strong justification to conclude that for this batch of EX-1515 cyanate ester resin a more representative resin density lies between 1.164 g/cm3 and 1.171 g/cm3, if not higher.
Figure 5. Boxplot of the density results from both the dimensional and specific gravity methods, with all measure values falling above the previous accepted value of 1.156 g/cm3.
Optical Microscopy
Optical microscopy offers a relatively simple method to estimate the potential amount voids in a material sample. The results from microscopy can be used to cross-reference the void volumes obtained thru ASTM D3171. However, the simplicity of this process also comes with inconsistencies in the accuracy and precision of the resulting data.
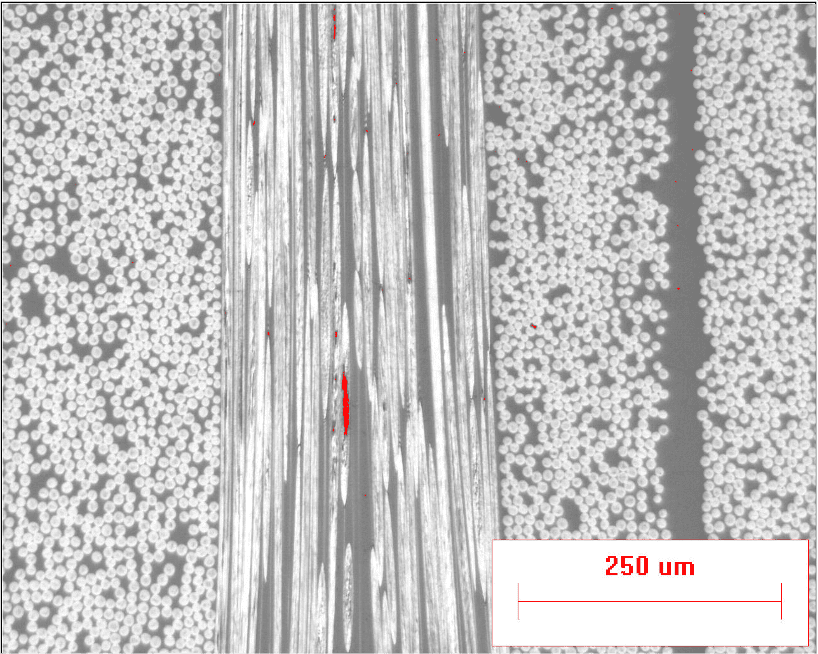
After collecting a survey of surface micrographs for the CN-60, Astroquartz and EX-1515 samples, the images were further processed with ImageJ software. ImageJ takes images and allows the user to specify which shade of pixels should be highlighted and measured by ImageJ. With the program, micrographs were processed to demarcate the darkest pixels, which represent the surface voids that do not reflect light back into the microscope. The void changes from dark black in the original micrographs to bright red in the edited micrographs, which the program adds up to produce a void volume (Figure 6).
Figure 6. Comparison of unprocessed carbon micrograph (top) and ImageJ processed carbon micrograph (bottom), with the identified void highlighted in red.
The results from the optical void measurement produced a high and low-end estimate for each material. The CN-60/EX-1515 composite samples had a low visible void volume range of 0.017%-0.027%.
The Astroquartz/EX-1515 composite samples had a larger void volume range of 0.072%-0.430%. The increase in range can be contributed to the behavior of the Astroquartz fibers, which appeared to exhibit a brittle nature with significant chipping occurring on the edges of the polished fibers. The chipping partially inflated the ImageJ results.
Finally, the neat EX-1515 resin had the largest range of 0.015%-2.35%. To try and represent trapped air bubbles inside the samples, a sample with a visible surface void was selected. The large surface defect gave a total optical void content of 2.35%. While the large specific void is not entirely representative of the voids in all samples, it gives an idea of the possible top end of void volume range that could reside within the samples.
ASTM D3171 Resin Digestion
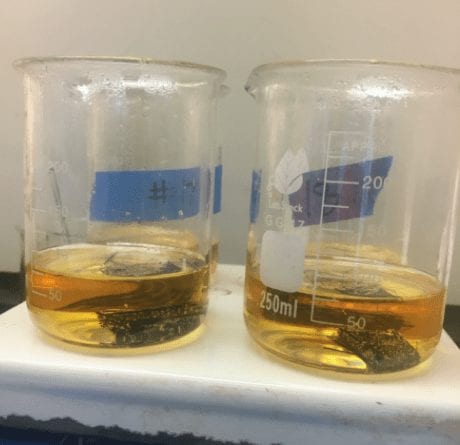
While Astroquartz fibers were separated from the EX-1515 matrix through a burn-off conducted by Toray, this method was not an option for the CN-60 carbon fibers. At elevated temperatures, bare carbon fiber can begin to oxidize and breakdown. Therefore, an alternate process of resin digestion was used with the carbon fibers. The process involved submerging composite samples in heated nitric acid in order to digest away the EX-1515 resin (Figure 7).
Figure 7. Experimental setup of 250 mL beakers with nitric acid and submerged CN-60 samples, nitric acid tinted yellow due to digested EX-1515 resin.
The experimental setup included four 250 mL beakers, filled with 75 mL of 70% nitric acid. One CN-60 sample was added to each beaker. After adding the samples, the beakers were heated to ~80 ºC for the duration of the digestion. The ASTM standard called for the samples to be submerged for 1-6 hours for full digestion. However, after three hours, it was evident that the EX-1515 resin would most likely take more than the ASTM specified six hours to fully be digested.
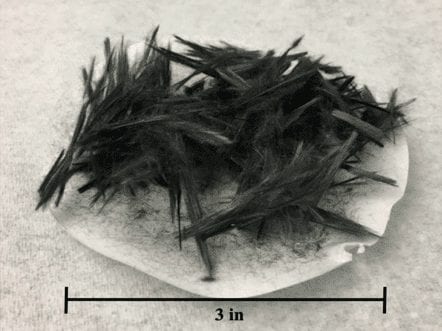
A total digestion time of ~14 hours was required before full matrix digestion was achieved. After final washing and drying, the bare fibers significantly expanded in volume when compared to the ordered fibers of the original samples (Figure 8).
Figure 8. Remaining fiber after digestion of one carbon sample
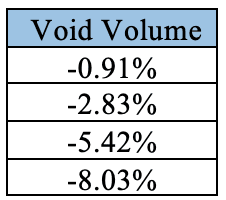
Unfortunately, the resulting void volume calculations for the samples digested in the Cal Poly Labs was removed from any data analysis considerations for the project. The extreme data spread from -0.91% to 8.03%, with little consistency of data in between, revealed that parts of the experimental procedure were flawed (Table I). For this reason, the void volumes that were analyzed with adjusted resin density values were all provided through testing done at Toray Advanced Composites.
Table I. CN-60 Calculated Void Volumes from Cal Poly Digestion
Adjusted Void Volumes
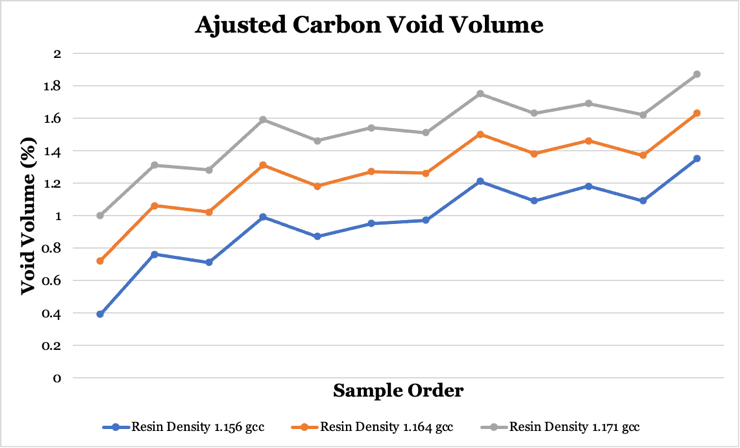
With the output fiber content from Toray’s resin digestion, void volumes for CN-60 samples were calculated with Equations 1, 2 and 3. Since the void volume equation utilizes resin density as one of the inputs, it was adjusted for the new EX-1515 resin densities measured during this project (Figure 9).
Figure 9. Void volumes from the CN-60 samples with adjusted values due to new input densities of 1.164 g/cm3 (orange) and 1.171 g/cm3 (grey).
Using the original resin density of 1.156 g/cm3 produced a calculated void volume spread of 0.4%. It was initially expected that the void volumes would result in being slightly negative due to the assumed density of EX-151 being too low. However, the results from Toray ended up as positive void volumes. While this does not invalidate the data, it points to the void content of the CN-60/EX-1515 laminate actually having a relatively large void content.
With the CN-60 samples, the density adjusted void volumes point to the actual void volume of the samples being between 0.7% and 1.6%. At this stage of analysis, the optical microscopy data would hopefully align with the adjusted void volumes. However, this is not the case, since the optical void volumes for the carbon samples only had a range of 0.017% to 0.027%. With a high original void volume and a lack of optical void data, it is difficult to draw any strong conclusions with the carbon data.
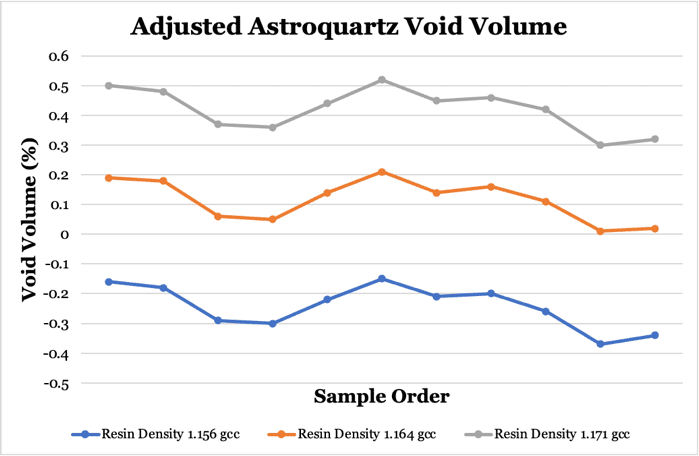
Using the Toray furnace setup, resin ignition was conducted on 12 Astroquartz samples to obtain the exact fiber content and thus calculate the sample void content. Using Toray’s stated EX-1515 resin density of 1.156 g/cm3, all 12 data points were slightly below zero (Figure 10). The non-adjusted values ranged from -0.15% to -0.34%.
Figure 10. Void volumes from the Astroquartz samples with adjusted calculated values due to new input densities of 1.164 g/cm3 (orange) and 1.171 g/cm3 (grey).
The adjusted void volumes for the Astroquartz/EX-1515 samples provided more logical conclusions. The original void volumes for the samples fell below zero, but as the chart reveals, when the void volumes were adjusted for the two new resin densities, the results rose into a more logical range of 0% to a little over 0.5%. The new range of void volumes also closely aligned with the optical void volume range of 0.072% to 0.430%. Even though the optical void data is not a perfectly accurate representation of the void volume in samples, the fact that it aligns closely with the more logical adjusted voids volumes is a convincing argument for the need to raise the EX-1515 density value from 1.156 g/cm3.
Conclusions
1. For this batch of resin, both dimensional and specific gravity methods of density measurement point to the need to increase Toray’s stated EX-1515 density of 1.156 g/cm3.
2. Void volumes produced with ASTM D3171 have a high degree of variability from small changes in procedure or input data, causing a large shift in percent void volume to both positive and negative values.
3. Optical microscopy should not serve as a single sufficient method for determining void content within a material due to its limited accuracy, and must only be used when combined with other methods.
Recommendations
1. Conduct another density survey on a new batch of EX-1515 resin to determine if the trend of measured resin densities in this project is consistent from batch to batch.
2. If it does appear that resin density values are consistent from batch to batch, Toray should raise the EX-1515 density value to between 1.164 g/cm3 and 1.171 g/cm3 in order to produce more logical void volume results.
3. Toray should put a low emphasis on calculated void volume results if they lie within ~±1%, due to the variability of ASTM D3171 with small changes in resin density.