Acknowledgements
We would like to personally thank Sarah Miles, Professor Yarrow Nelson, Dr. Trevor Harding and Sinclair International

Angus Kojimoto
He/Him/His
2nd year transfer student from Santa Rosa, California

Ben Kohlbush
He/Him/His
2nd year transfer student from San Luis Obispo, California
Our Project's Digital Poster
Sample Prep
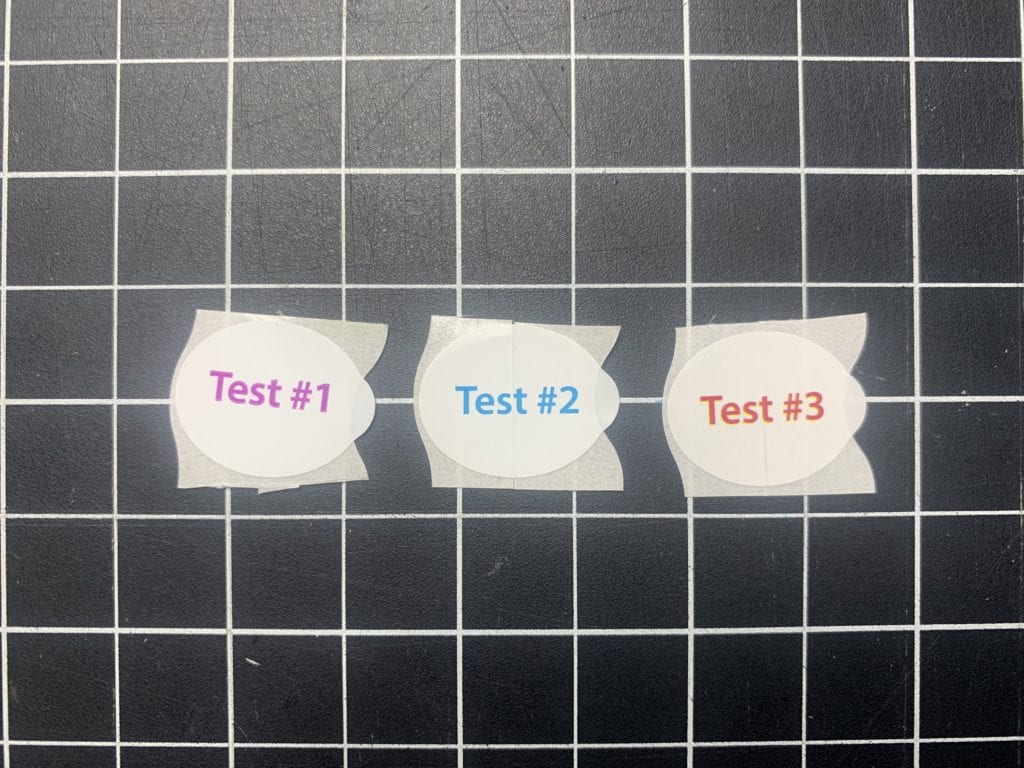
Sinclair International sent out 3 different types of labels including paper, polyethylene and compostable. This project focuses on Sinclair International’s certified compostable fruit labels. They are certified for municipal conditions, however, the labels were subjected to home composting conditions.
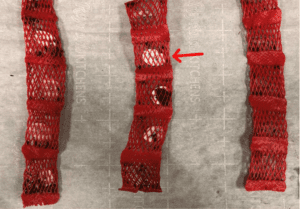
Samples were placed into mesh bags to be composted. Each mesh bag contained 5 samples.
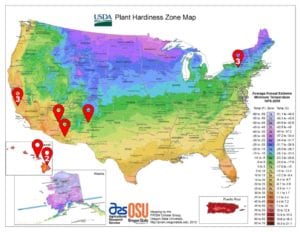
Samples were sent out to various regions across the United States. These regions include New York, New Mexico, Arizona, Hawaii and Atascadero California.
FTIR
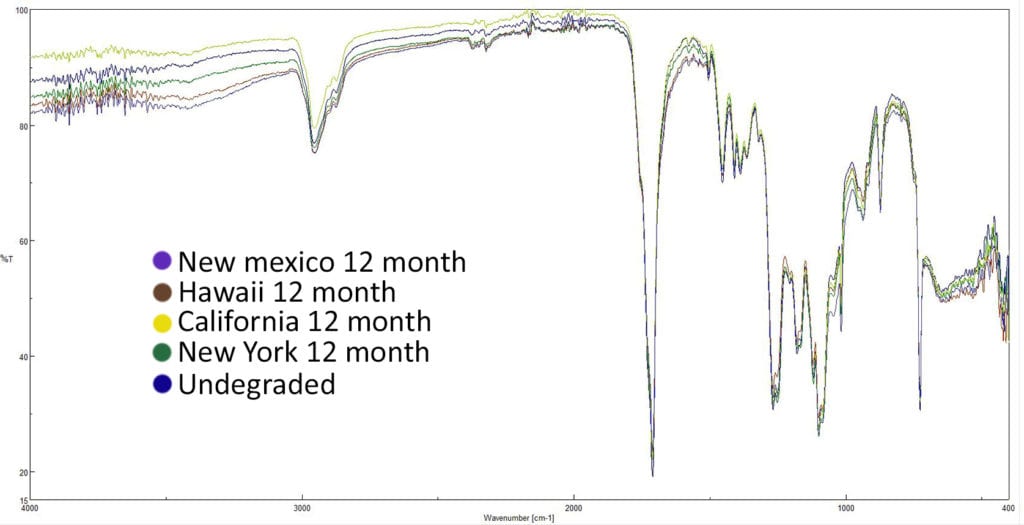
Fourier Transform Infrared Spectroscopy (FTIR) was done to measure the amount of degradation occurring. The figure above displays an overlay of an undegraded sample and samples from various regions after 12 months composting.
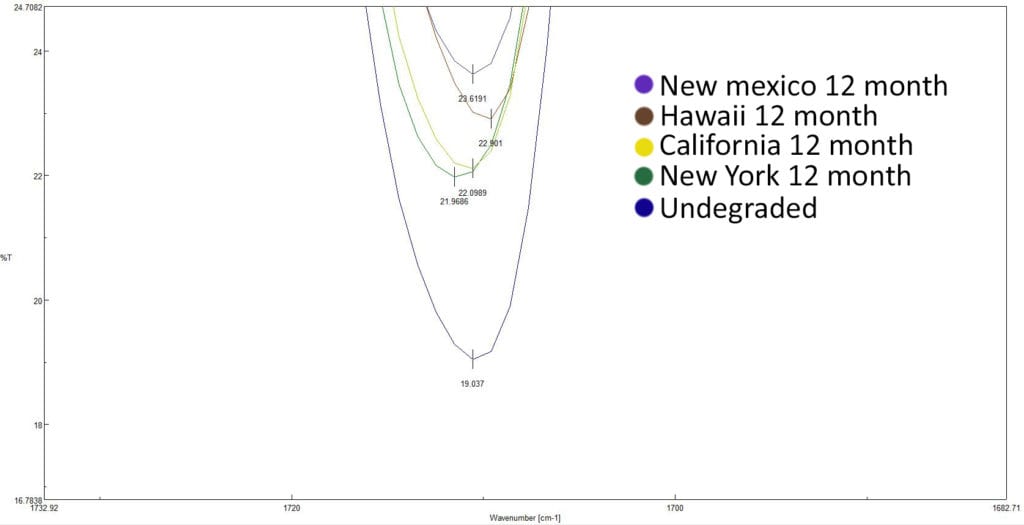
The main peak at roughly 1700 cm^-1 is zoomed in on to show the relative intensities of each peak. It can be seen that all of the different regions produced consistently higher levels of transmittance in comparison to the undegraded sample. This shows that there was degradation present in each of the composted samples.

This project is sponsored by Sinclair Labs International
SEM
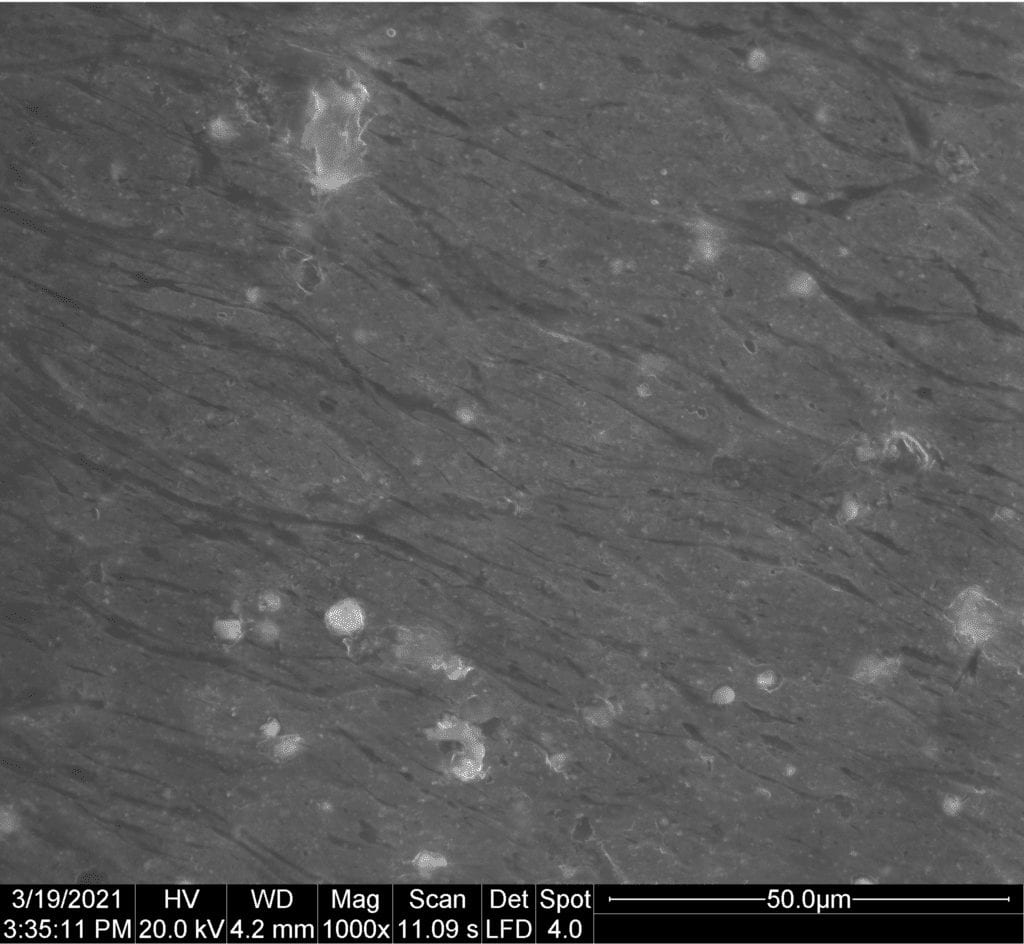
Above is an image of an undegraded compostable label at 1000X magnification. The marbling pattern is most likely caused from the manufacturing process, stretching the polymer while it is cooling. The DSC data also shows that the sample is effected by the manufacturing process which increases its crystallinity.
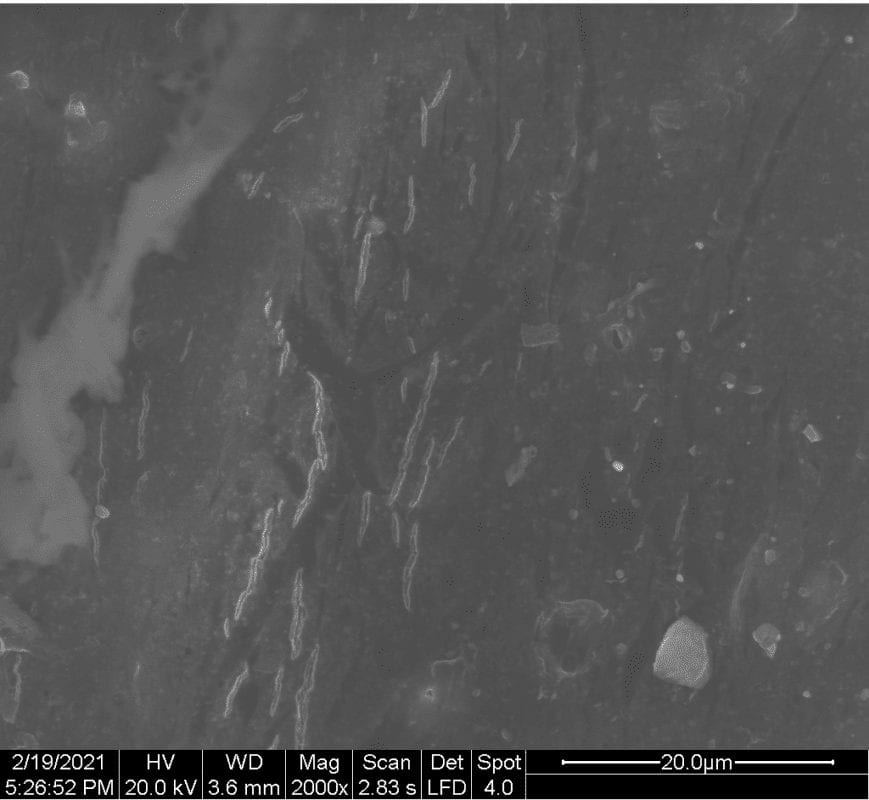
The California 12 month sample (seen above at 2,000X magnification) has small cracks that are 5 to 10 micrometers long. The cracks are caused by bacteria in the compost eating away at the amorphous regions of the polymer. The same marbling pattern can be seen on the 12 month sample. The cracks seem to follow the lighter areas and avoid the dark parts, this might indicate that the dark parts are more crystalline that the lighter parts.
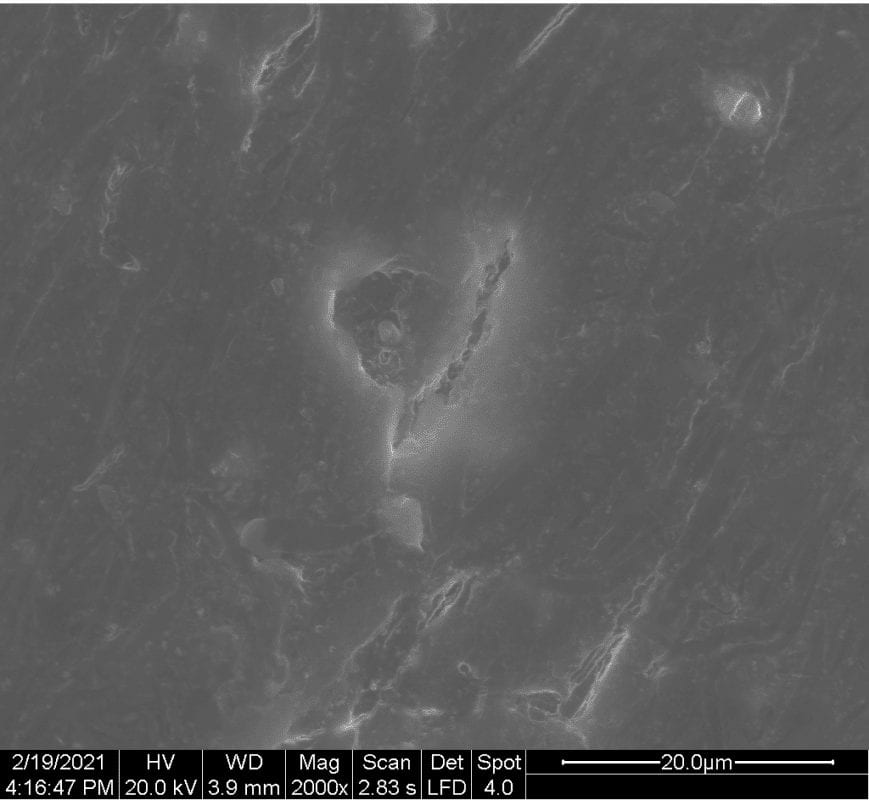
Above in an image of the Hawaii 12 month composted sample. Like the California sample similar cracks can be seen on the surface, also ranging from 5-10 micrometers. All of the 12 month samples showed similar signs of degradation.
DSC
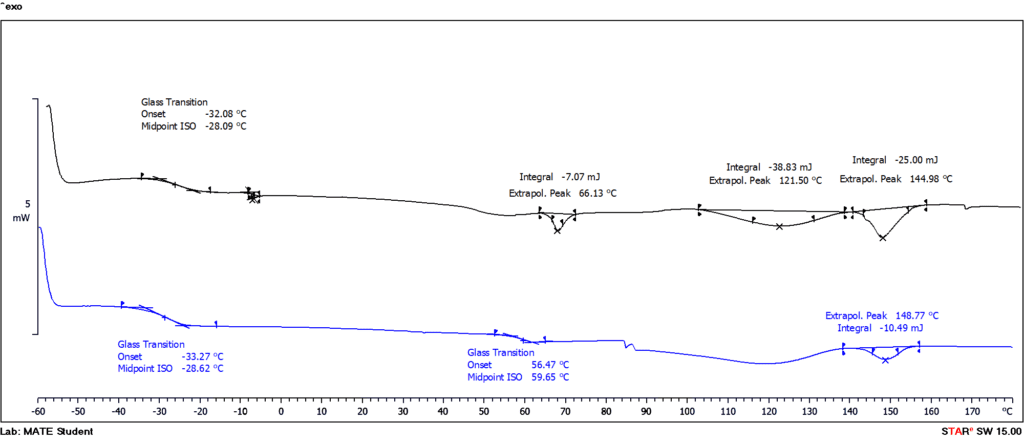
The DSC graph above shows two heating cycles from -60 to 180 degrees Celsius. The first heat shows three endothermic peaks which indicate the melting points of polymers in the sample. The size of the peaks represents the amount of crystallinity. In the second heat the endothermic peaks are gone this shows that there is crystallinity in the material as a result of manufacturing. Most likely do stretching the polymer while it is cooling.
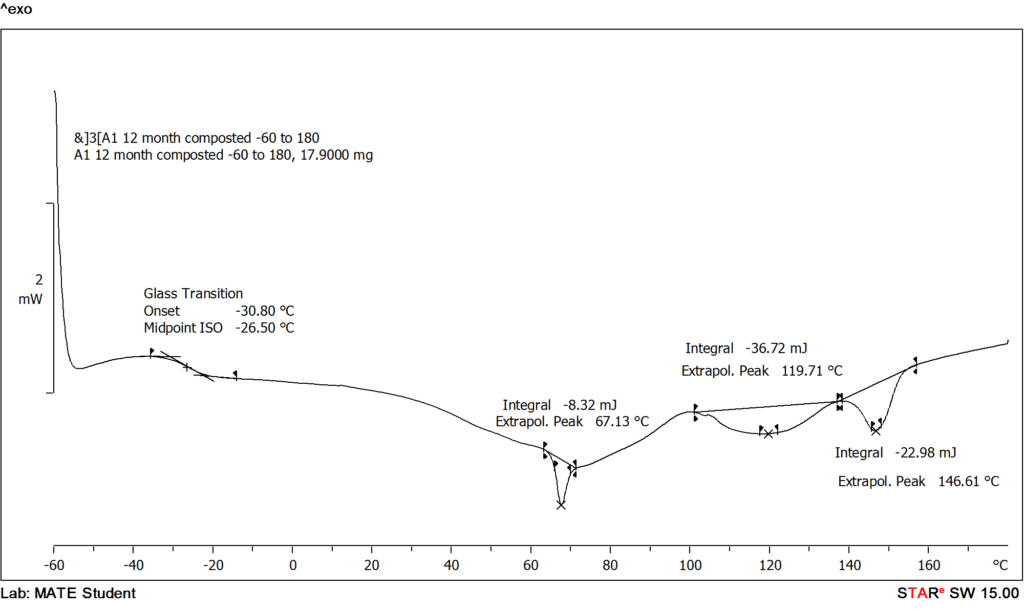
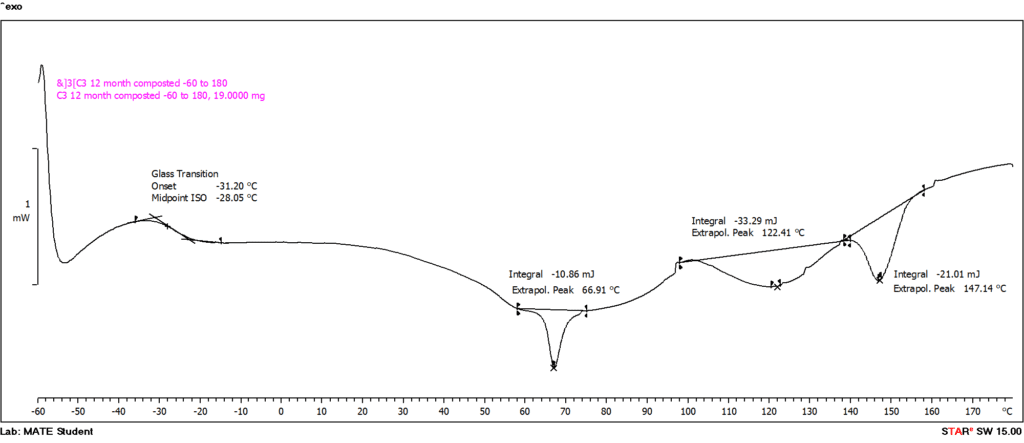
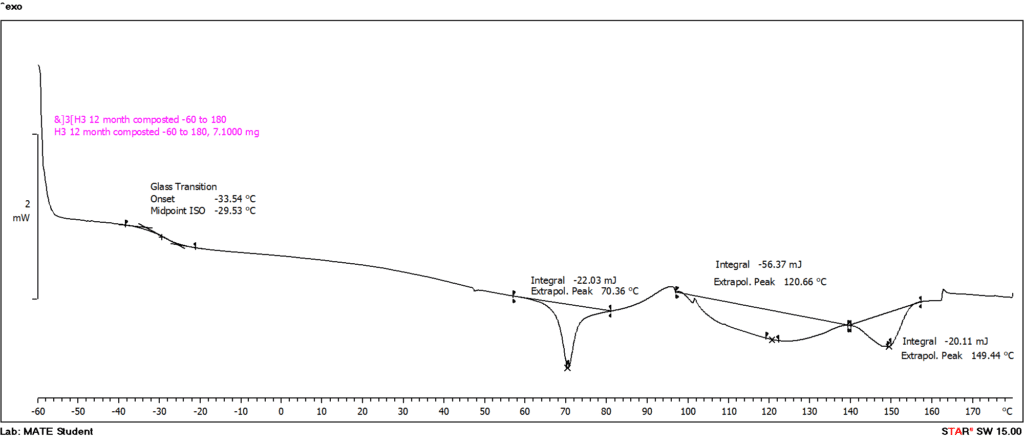
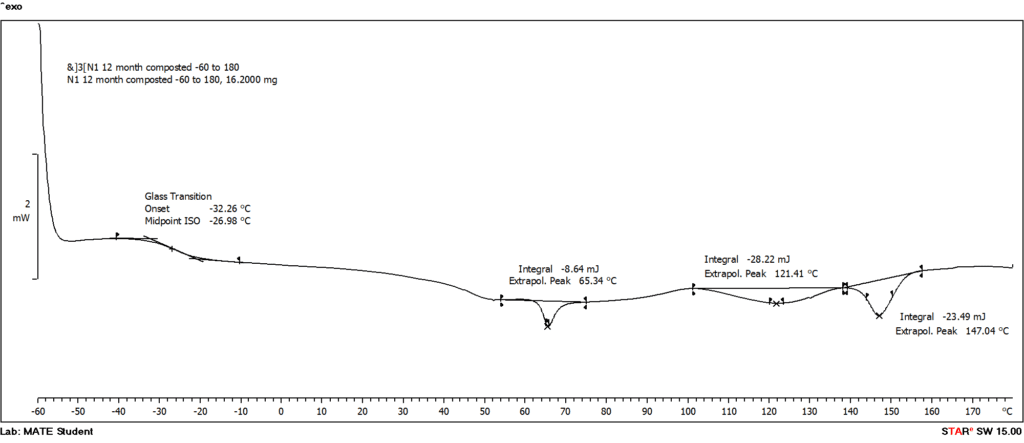
The DSC data on the 12 month samples show no significant change from the undegraded samples. The change in crystallinity is too small for the DSC to accurately detect. All of the 12 month samples were the same.

