
Our Team
Our Team is comprised of three Senior Industrial Engineering Students

Jacob Hrbek
Lead Data Analyst
Jacob Hrbek is a fourth-year student at California Polytechnic State University, San Luis Obispo. He is completing is Bachelor of Science in Industrial Engineering while also working to attain his Masters in Engineering Management through the blended program. He will complete his degrees in the Fall of 2021 and hopes to move to the bay area to pursue a career in Industrial Engineering.

Jennifer Zakaria
Project MAnager
Jennifer Zakaria is a fourth-year student at California Polytechnic State University, San Luis Obispo. She is completing a Bachelor of Science in Industrial Engineering. Jennifer has been involved in the Systems Optimization Club (SOC) and served as the Materials Manager this academic year. Following graduation this June, she will be working for RSM in San Francisco as a Consulting Associate.
")
Nicolas Bowes
Financial Analyst
Nicolas Bowes is a fourth-year student at California Polytechnic State University, San Luis Obispo completing his Bachelor of Science in Industrial Engineering. Nicolas has been heavily involved with the Systems Optimization Club (SOC) during his four years of study, serving most recently as Club President. He also is pursuing a LeanSixSigma Green-Belt that he hopes to combine with his passion for engineering management in his career.
Acknowledgements
The Team would like to thank and acknowledge the help provided to us by all of our mentors and advisors. We would like to thank John Juell and Jackson Lisec from Epirus Systems for providing us with information about Epirus, their goals, as well as lots of advice on the content of our dashboard. We would also like to thank Connor Francis from ION First Resonance for providing us with technical support on the MES system, data extraction and data processing. The advice provided to us by our sponsors and our senior project advisor Karen Bangs has made this projects successful completion possible.
Our Project's Videos
Please enjoy the team’s final presentation video, including a walkthrough of the Tableau Dashboard. We have removed technical information from our dashboard in this video due to our NDA with Epirus Systems.
Our Project's Digital Poster
Introduction
Epirus Systems is a 2 year old defense startup. Epirus’ core product is a device that can take down unmanned aerial vehicles with a targeted EMP. Epirus Systems started manufacturing during the summer of 2020, using a preliminary Manufacturing Execution System provided by ION First Resonance. They had been collecting manufacturing data, but had no plan for data flow or visualization.
Objectives
This project has been tasked with creating a fully automated data visualization plan for Epirus Systems to be able to track their manufacturing operations based on the following KPIs:
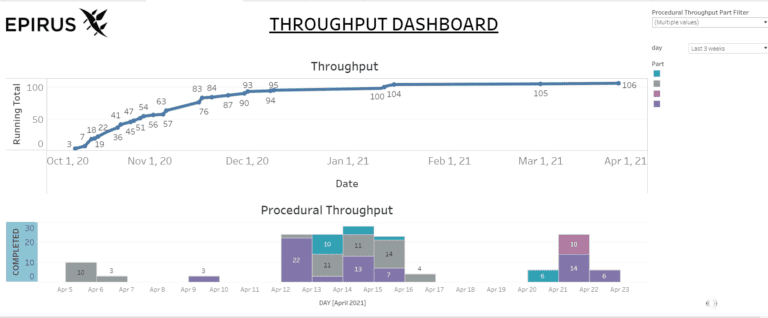
- Throughput – daily and weekly throughput metrics as well as average build times per part and per subprocess.
- Accuracy – incorporates data with outliers removed.
- Automated – system involves minimal effort to update dashboards for daily meetings
- Re-work – Epirus wanted to know which items have been reworked, and the wasted time associated.
Possible Solution Directions
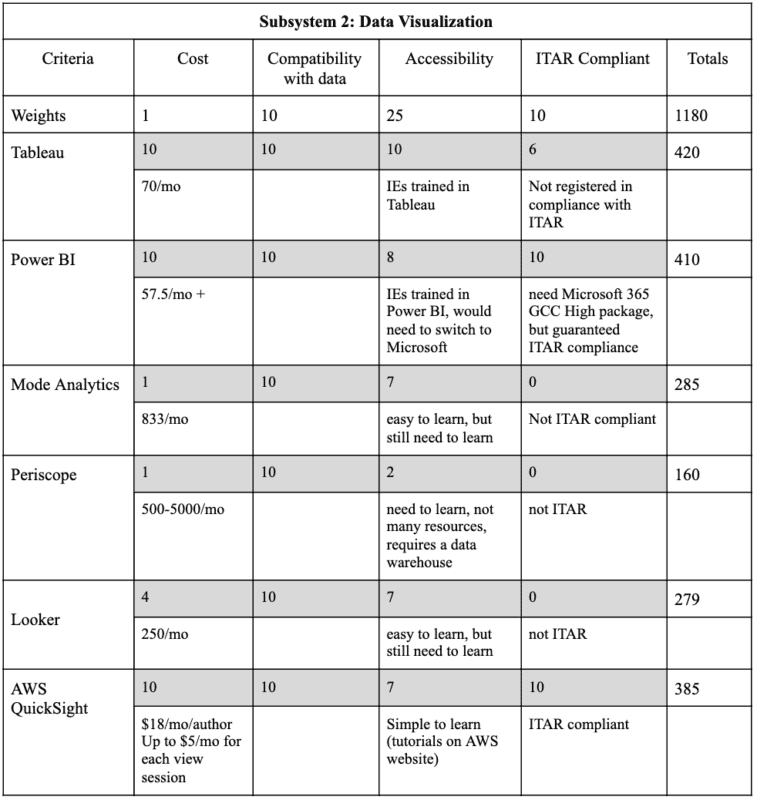
- The project team had to make two key decisions about possible solution directions. These decisions were selecting a system for data extract transform and load (ETL) as well as selecting a software for data visualization. The possible solution directions for data ETL included Python, excel, or completing the ETL within the visualization software. The criteria used for making this decision were automation capabilities, accessibility, mutability, and whether the software was readily available to Epirus. The possible solution directions for a visualization software were Tableau, Power BI, Mode Analytics, Periscope, Looker, and AWS Quicksight. The criteria used for selecting the software was cost, compatibility with data, accessibility and ITAR compliance. A multiple criteria decision analysis table was utilized to make these decisions.


Literature Review
For this project, the Cal Poly senior project team had to become experts on processing, analyzing, and visualizing manufacturing floor data for the stakeholders involved. To do this, the team reviewed five sources related to manufacturing execution systems (MES) with the intent to understand the MES Epirus currently used: ION First Resonance. Further, the team investigated ten sources on data analysis with particular reference to data management, extraction, cleaning, and analysis. Nine sources were used to help determine best solution alternatives, four to understand and apply various cost analysis techniques, and three to achieve a better understanding on the defence industry as a whole. This research helped the team provide a comprehensive report and useful visualization tool at the conclusion of the project.
This project is sponsored by Epirus Systems in partnership with ION First Resonance
Solution Selection
Sample Subheading
The team conducted extensive research in order to decide upon the best fit Data Visualization tool for Epirus Systems using their ION First Resonance MES Server.
Multi Criteria Decision Analysis
Based on a Multi Criteria Decision Analysis, the team selected Tableau as the best solution alternative, ranking slightly better than Microsoft PowerBI.
Tableau
DECISION CRITERIA
Cost – Although Epirus Systems assured the team that cost was not a huge concern, it was still a consideration when deciding upon the final solution direction. Tableau was one of the least expensive options, costing $70/month for each user subscription and $12/month for viewing licenses.
Compatibility with Data – A major consideration for the software solution was compatibility with Epirus data. ION First Resonance uses Amazon Web Services Athena to store their clients’ data, so the team needed to ensure that the data was easily linkable or transferrable to the software solution. Tableau was one of the most ideal solutions under this criteria as users can link live data from AWS Athena directly to Tableau files.
Accessibility- Accessibility, meaning the current knowledge base of the team and sponsor, was also a consideration. Since each member of the project team had previously used Tableau through IME coursework, there was a decent base knowledge. Epirus was also most familiar with Tableau and, at the time of software selection, was not operating on Microsoft Applications.
ITAR Compliance- Epirus Systems requested that the data visualization tool be ITAR compliant. Although Tableau is not registered in compliance with International Traffic In Arms Regulations, Epirus requested that the team proceed with Tableau.
Implementation
Specifications
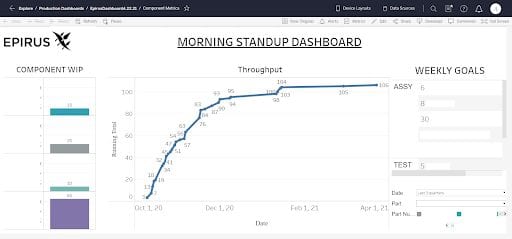
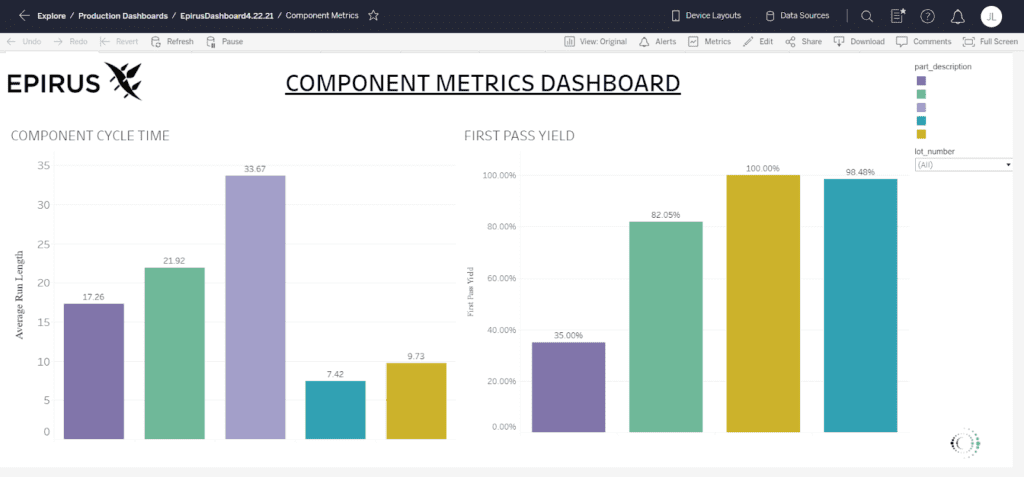
As with most implementations, there was a little bit of back-and-forth between the two teams in order to get the most valuable product. With three months remaining until the deadline of the project, the Cal Poly project team provided the sponsors at Epirus with a beta version to verify it streamed live data properly in the visualizations created. During the weeks after the team confirmed it worked the way it was intended, the Cal Poly and Epirus teams collaborated on edits to improve the usefulness to the production team. The result of these collaborations were the additions of “First Pass Yield”, “Weekly Goals”, and “Quality” visuals. With a month and a half remaining, the dashboard was implemented into the daily production meetings while the teams continued to collaborate on small tweaks to the design. Finally, with a month remaining, the dashboard became fully implemented and a video manual for operation was provided.
Dashboard Snapshots
User Guide
- We created a 5 minute long user guide for “How to use Tableau with a Viewing License.” Epirus Systems will use this to train administrative employees on how to view and navigate through the Tableau Dashboard in order to make important business decisions. Due to our Non Disclosure Agreement with Epirus, we are not able to share this video.
Verification & Cost Savings
The team conducted an Economic Analysis to conclude the labor savings, Internal Rate of Return (IRR) and Net Present Value (NPV) of the project. Below are our parameters used for the IRR calculation.
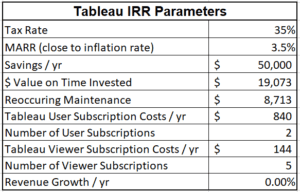
Based on the parameters above and an approximated 500 saved labor hours annually:
- $50,000 in direct Labor Savings/yr
- 79% Internal Rate of Return
- $83,941 Net Present Value (over 5 yrs)